“The stock market is a giant distraction from the business of investing.” -John Bogle
It might not feel like it, but stocks were having one of their strongest and least volatile years ever just a few weeks ago. Now it feels like each day has more worries and more volatility. To help, we put together this list of things to know during this latest bout of August volatility.
What Is Causing the Volatility?
There are three main drivers: a weakening economy, the unwind of the yen carry trade, and the Federal Reserve (Fed) likely being way behind the curve on rate cuts.
Let’s start with the Fed. We’ve been in the camp that inflation was last year’s problem and they should probably have already started cutting. With inflation coming back down quickly, there is really no reason to have rates up over 5%. Leaving rates too high for too long slows the economy and hits small businesses and housing especially hard. Remember, back in 2018 a policy rate of just 2.5% was enough to start breaking the economy? The current economy has endured a 5.5% policy rate for over a year now. The aggressive rate hikes were absolutely necessary to help fight inflation, but the greater risk now is on the growth side.

Stay on Top of Market Trends
The Carson Investment Research newsletter offers up-to-date market news, analysis and insights. Subscribe today!
"*" indicates required fields
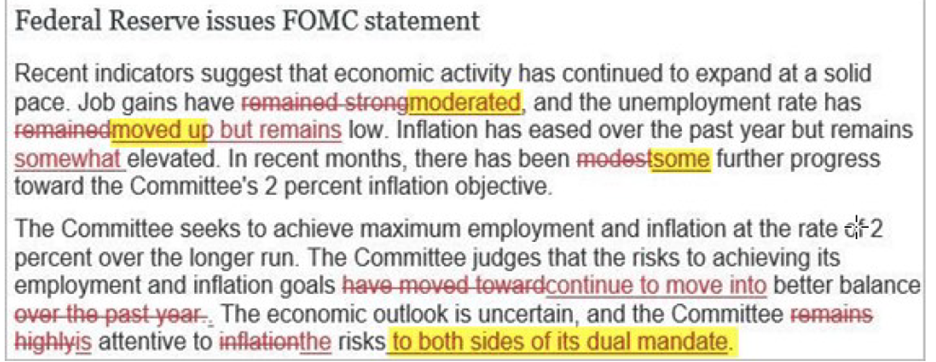
Last Wednesday the Fed decided against cutting rates, but the stage is set for a cut in five weeks at their next meeting. The odds are increasing that first cut very well could be 50 basis points (0.50%) to make up for not cutting last week. The bottom line, the Fed tends to wait till they absolutely have to do something and once again we think they are behind the curve. Here’s the statement from the Fed meeting that concluded last week (complete with the changes from six weeks ago), which came off more hawkish than most expected.
Source: Federal Reserve Bank, Carson Investment Research 7/31/2024
On top of that, the Japanese stock market outright crashed after the Bank of Japan (BOJ) surprised many and hiked interest rates last week. You see, the Japanese yen has soared more than 10% versus the US dollar in just a few weeks, as the yen carry trade unwound, causing many risk assets to be sold as a result. What’s the carry trade? Traders for a long time have borrowed and then sold Japanese government bonds, due to their very low yields. This is the equivalent to borrowing in yen at Japan’s still ultra-low interest rates. They then took the proceeds and invested them in higher yielding bonds or stocks. But then last week the BOJ surprised markets and increased interest rates for the first time in 15 years from -0.1% to 0.25%. That rate hike sparked fears that the cost of borrowing could quickly become more expensive if the yen continued to appreciate, leading to heavy selling of riskier investments.
In response, the Japanese stock market had it’s worst two-day return ever, including falling 12.4% yesterday, the second worst single day ever (only 1987 was worse).
The third reason for the massive volatility is fears over the US economy slowing, potentially into a recession. At this time we don’t expect a recession, as this is more likely a growth scare, which aren’t uncommon, but it has many worried. Last week we saw disappointing manufacturing data and some high profile earnings misses, and then Friday saw the monthly nonfarm payroll come in low at 114,000 jobs in July, versus a consensus expectation of 175,000, while the unemployment rate ticked up to 4.3%. Those aren’t horrible numbers, but they do suggest slowing economic growth.
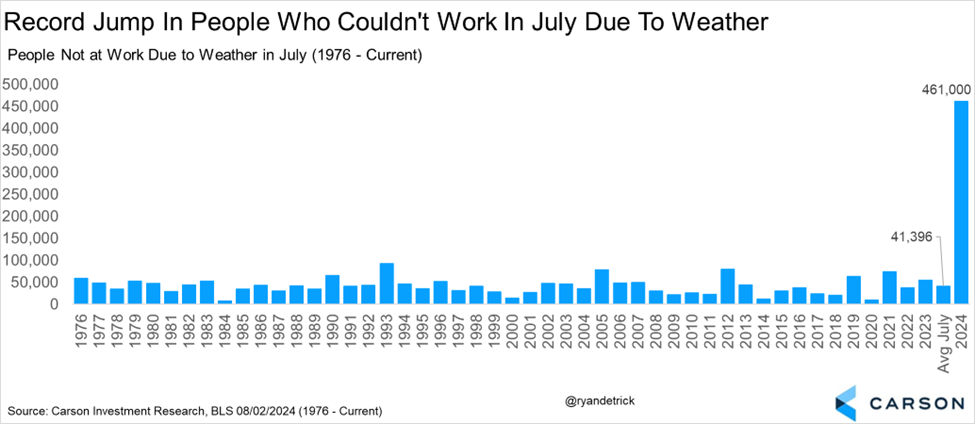
We do see some potential slowing, but we also think the reaction to the weaker-than-expected jobs number was overblown. For starters, 1.3 million households and businesses were still without power a full week after Hurricane Beryl. Adding to this, the state of Texas saw initial jobless claims double from the previous month and we saw a historic spike in temporary job losses. Lastly, 461,000 people said they couldn’t work due to weather in July, which was more than 10 times the July average. Seeing all these “one off” factors, we are optimistic many jobs will come back in August.
Things Were Too Good and Too Calm
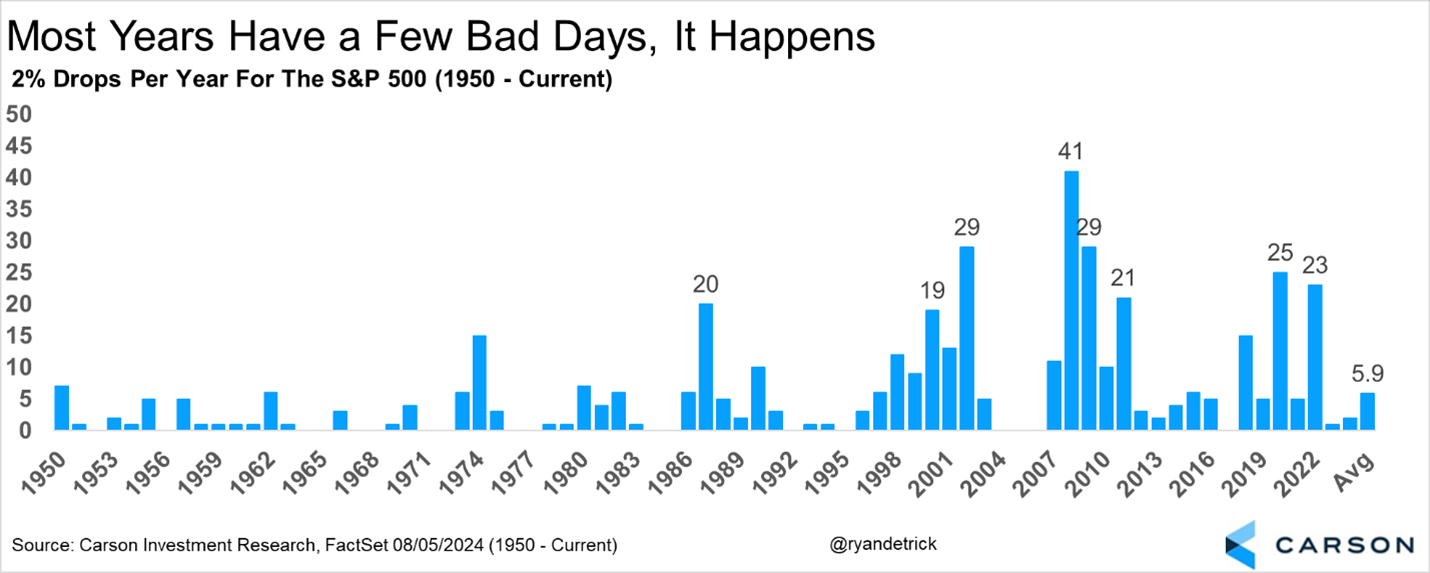
As good as things were, we were probably due for some volatility. The S&P 500 went nearly 18 months without a 2% decline. Now there have been two 2% declines in nine days and we just missed number three on Friday. But it’s important to remember even some of the best years have a few bad days.
There were also some areas of the market that had become stretched. Technology and AI were all the rage for most of 2023 and the first half of 2024, then they weren’t. We see incredible potential here, but the truth is many of these names likely got ahead of themselves and a market swing the other way was perfectly normal.
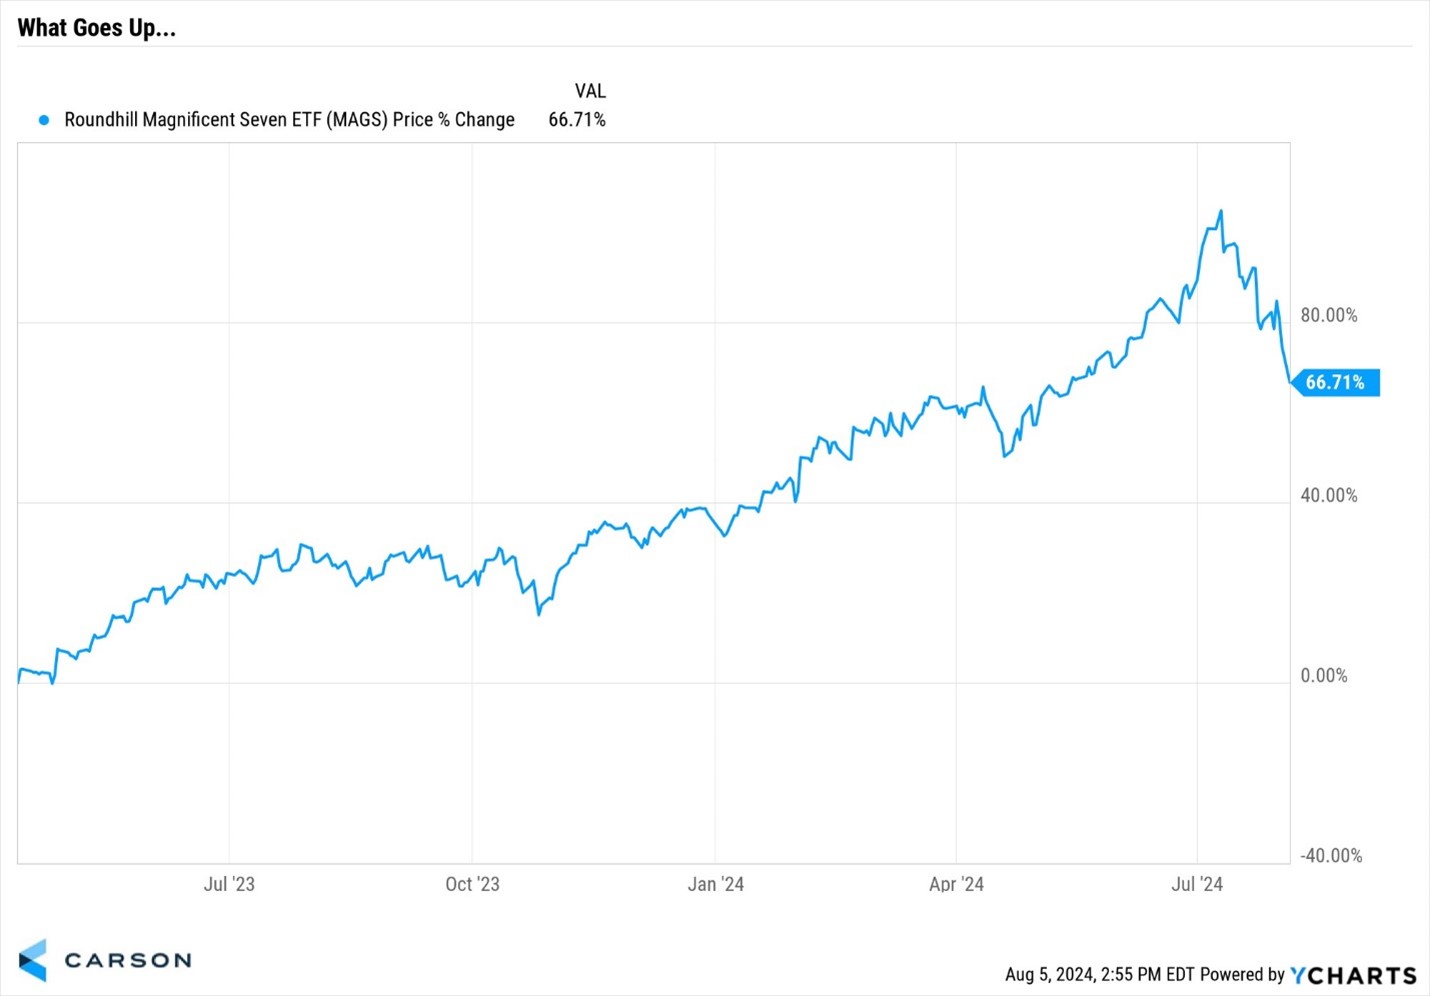
How overextended were these areas of the market? Well, there’s an ETF that is based on the Magnificent Seven stocks (think the biggest technology-oriented companies in the world) and that ETF had more than doubled since last spring. This group was ripe for a violent move eventually. Still, don’t forget that the Mag 7 delivered nearly 30% earnings growth this most recent earnings season. These companies have been strong earnings engines—the market just got carried away by its enthusiasm.
Chaos and Volatility Are Normal
Geopolitical worries are growing, along with some of the other worries we’ve already discussed. It is important to remember that most years will have scary headlines and potentially some terrible events. But over time stocks go higher and we don’t think this time will be any different.
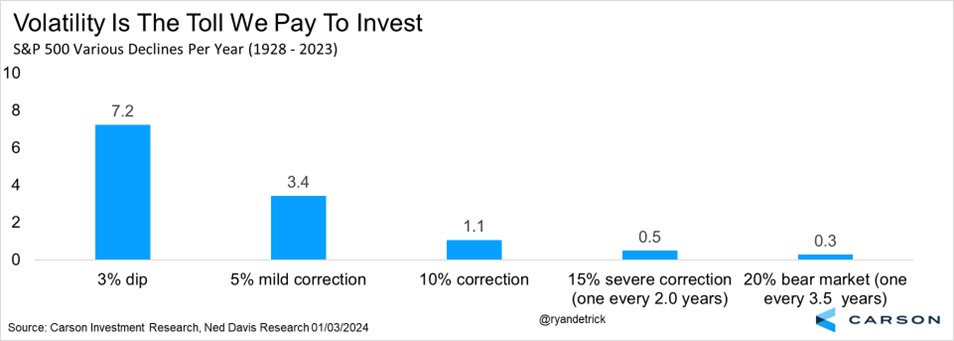
We like to say volatility is the toll we pay to invest and we are paying that toll right now, with the second 5% mild correction of the year for the S&P 500 taking place right now. But remember, on average, the S&P 500 sees more than three 5% mild corrections a year and one 10% correction a year. None of them are fun, but they are part of investing.
Some Good News
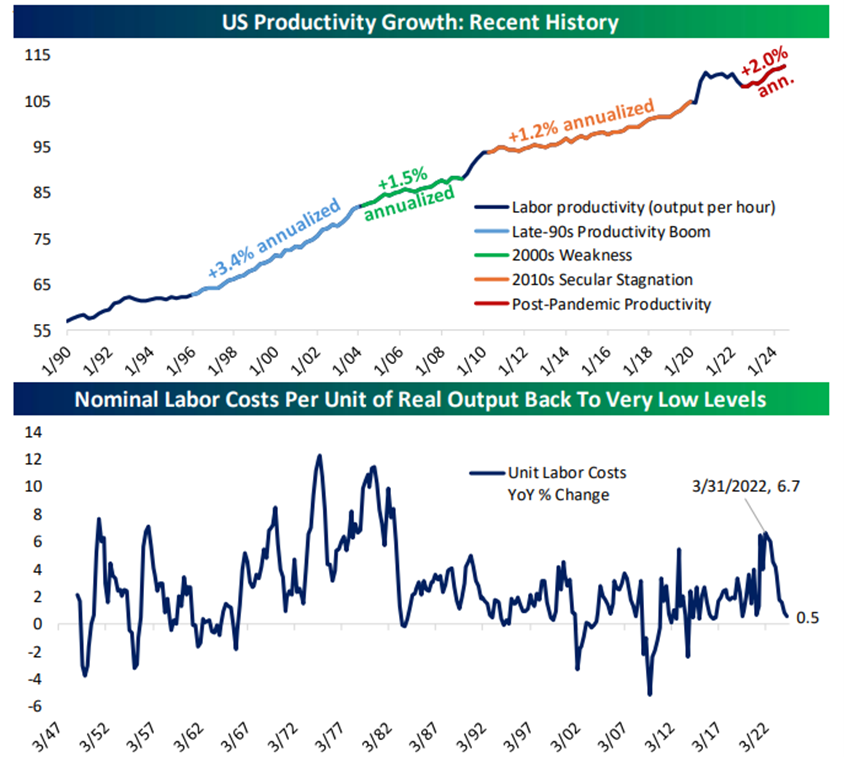
Things aren’t great, but they aren’t that bad either. Productivity in the second quarter came in much better than expected. We’ve been in the camp that better productivity would be coming and would support better economic growth. As a result of the strong productivity, unit labor costs have pulled back, putting a lid on overall inflation. (Workers are more cost efficient when they’re more productive.)
Source: Bespoke
Earnings have been quite strong, with second quarter S&P 500 earnings expected to be up 11.5%, the best quarter since late 2021. Additionally, forward 12-month guidance continues to move higher, not something you’d expect to see if a major recession were right around the corner.
Time Is on Your Side
They say the stock market is the only place that people run out of the store screaming when things go on sale. Well, there are likely a lot of stocks many people loved a month ago that have become significantly cheaper, but now investors don’t want to touch them. But here’s a secret. Investors who focus on long-term goals have time on their side, and that’s a big advantage over hedge funds and computers.
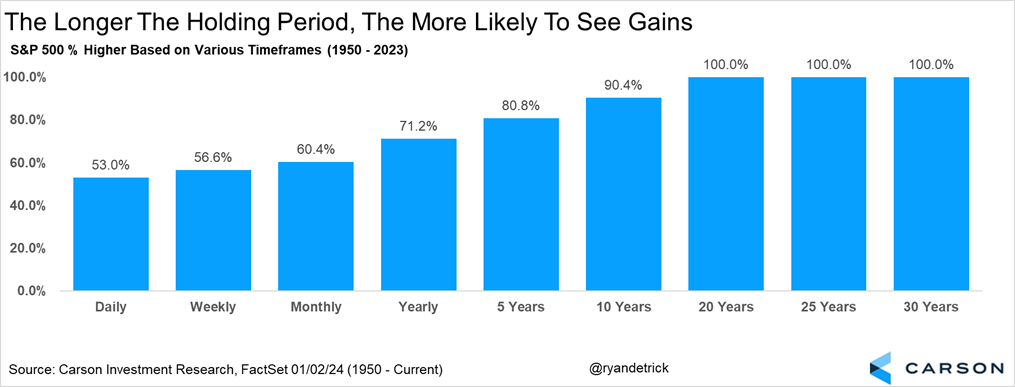
One of the wisest stock market sayings goes, “It is about time in the market, not timing the market.” Below shows how stocks tend to produce positive gains the longer you hold. Also, imagine the impact from buying when stocks are down (like many are now)? These returns likely only get even better.
Is 2024 Really That Different? Not Yet.
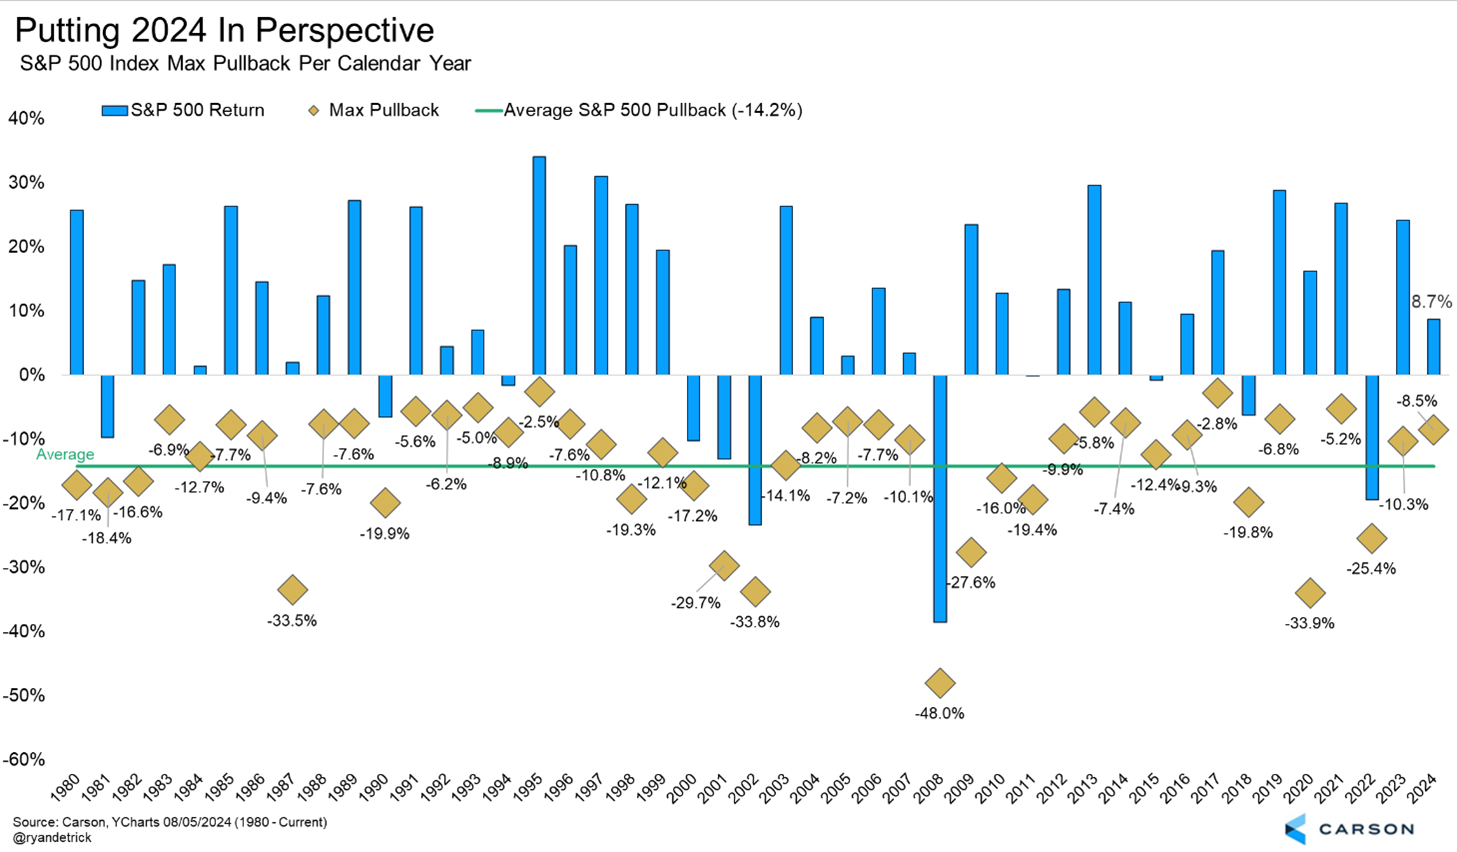
Since 1980, the average year sees a peak-to-trough move of 14.1% and gain of 10.3% for the year. As of Monday, the S&P 500 had pulled back 8.5% from the mid-July peak and was still up a solid 8.7% for the year. Sure it is a far cry from the nearly 19% gain in mid-July, but where we are now isn’t all that bad, or all that different from a typical year.
This Time Is Different
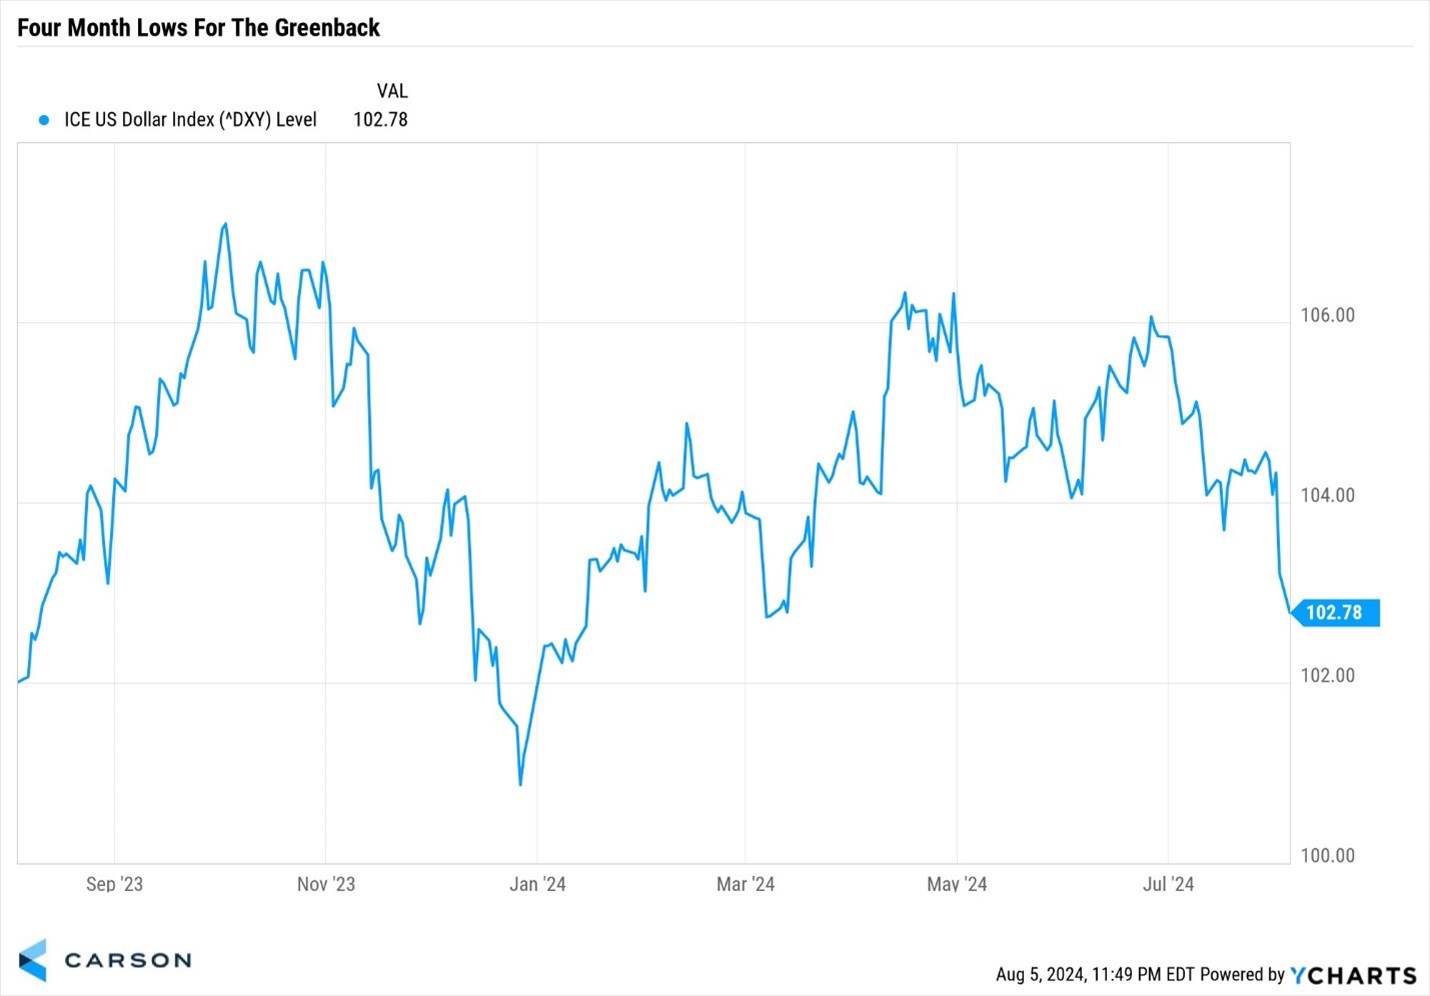
Sir John Templeton said the four most dangerous words in investing are, “This time is different.” Nothing is truly different and nearly everything that will happen in the future has already happened in the past in some form. So what looks different now that could provide a clue on what’s really going on? One thing that is quite different now from other past major times of trouble is the action in the US dollar.
Most times we’ve seen a major risk-off scenario in recent history we’ve also seen investors flock to the safety of the old greenback. Go back and look at March 2020 for instance. Stocks and bonds were hit hard. Even gold was selling off. You know what wasn’t? The dollar, the cleanest shirt in the dirty laundry. Then look at 2022, when both stocks and bonds were having horrible years the first 10 months of that year. You know what had one of its best first 10 months ever? Yep, once again the dollar. Now compare that with what we’ve seen the past few days. The dollar has actually sold off. By contrast, we’ve seen emerging market currencies soar, which is totally inconsistent with a major crash on the horizon. If a major systemic issue was brewing we’d expect to see the dollar finding more of a bid.
Buying Thrusts Suggest More in the Tank
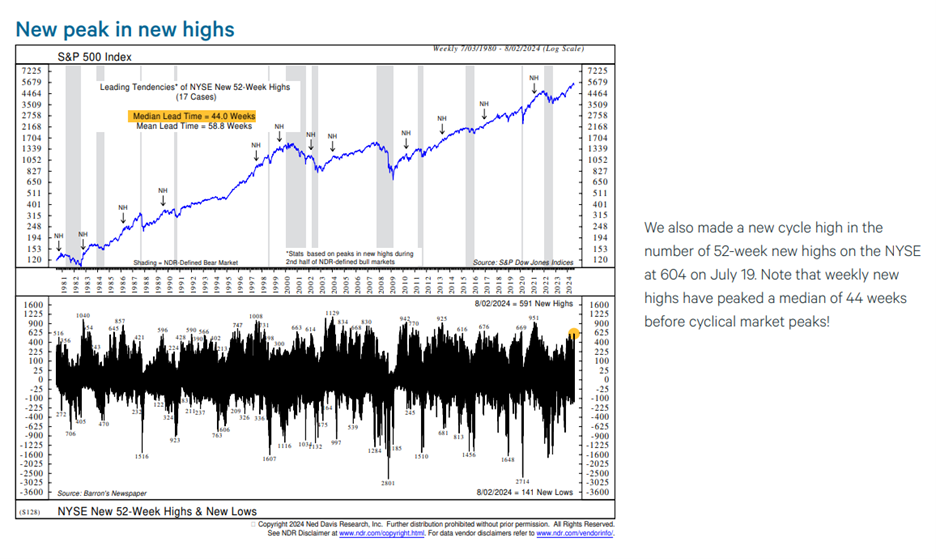
Mid-July we saw multiple buying thrusts, captured by seeing many stocks hitting 52-week highs, also inconsistent with a new bear market right around the corner. According to our friends at Ned Davis Research (NDR), on July 19 the New York Stock Exchange (NYSE) made a new cycle high of the number of stocks at their 52-week high. This matters, as historically the market hasn’t peaked for another 44 weeks after this has happened on average. In other words, it would be quite rare for the number of highs to peak along with the price.
Panic Is in the Air
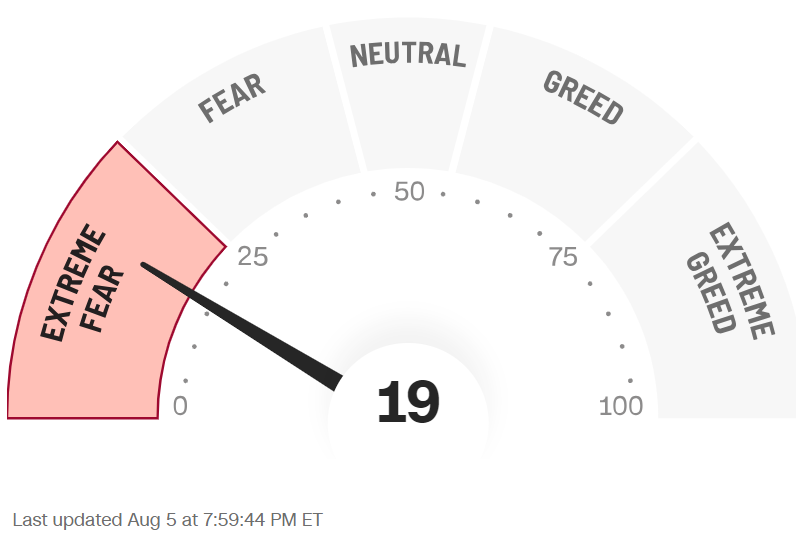
History tells us to buy when others are fearful. Well, fear is in the air. What is amazing is the S&P 500 isn’t even in a 10% correction yet, but we are seeing some extreme fear. From a contrarian point of view, this could be a bullish signal. It doesn’t mean ‘the lows’ are in, but the odds are good in three to six months stocks will be a good deal higher.
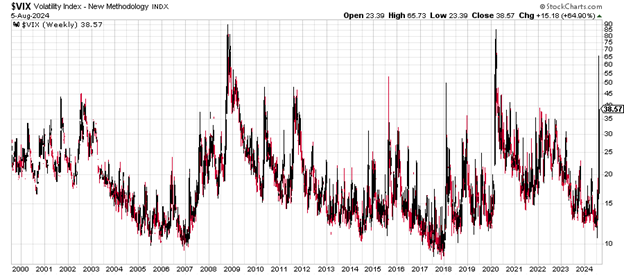
The CNN Fear and Greed Index is flashing extreme fear currently and the Volatility Index (VIX) just soared to one of its highest levels ever. It might not feel like it now, but many investors have been rewarded historically when buying in similar situations.
Source: CNNMoney
Diversified Investors Are Being Rewarded, Finally
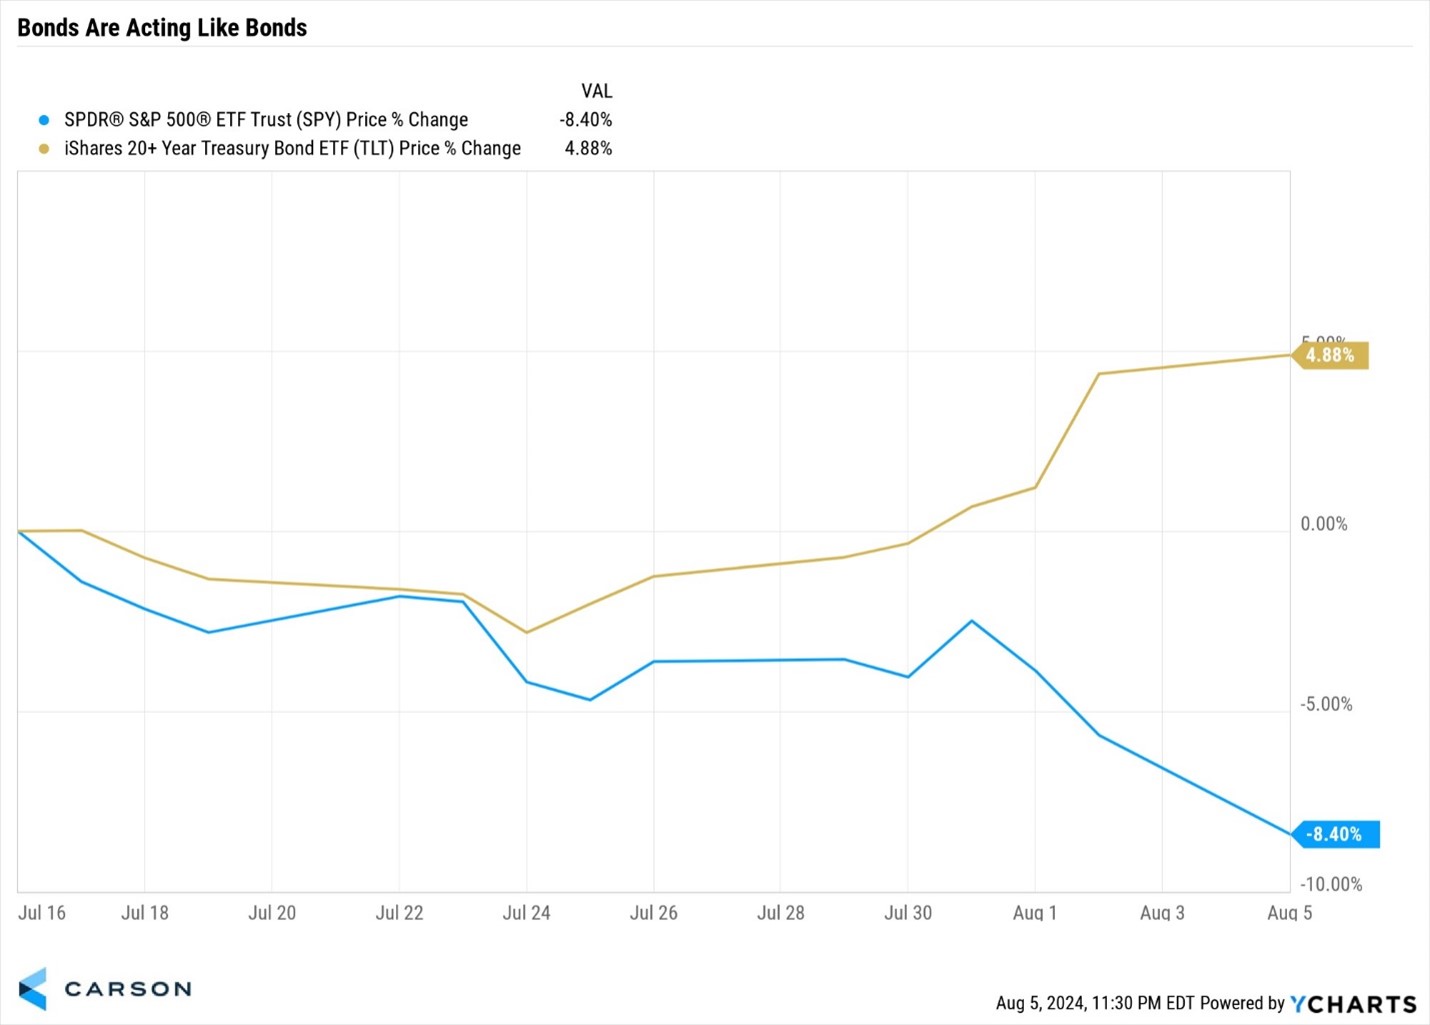
Since the S&P 500 peaked on July 16 it hasn’t been fun for stock investors, but did you know bonds were doing very well? It wasn’t that long ago, just in 2022, that both stocks are bonds were down more than double digits for the first time in history. Well, we appear to be moving back to more historical precedent with bonds zigging when stocks zag. In fact, since the S&P 500 peaked in July longer-term bonds were up close to 5%, while stocks were down more than 8%. That is a nice cushion for investors when they need it.
We want to stress seeing bonds act like bonds is something we haven’t seen in a long time. When stocks fell 25% during the bear market of 2022 longer-term bonds fell even more, down 26%. Even during the Regional Bank Crisis in March 2023 when stocks pulled back more than 7%, we saw long-term bonds down nearly 2%. Then during the 10% correction during the fall of 2023 we once again saw long-term bonds down more than 13%. The bottom line is bonds haven’t really helped act as a diversifier the last few years and they finally are again. This is a reason for investors to indeed celebrate, since portfolios tend to be more resilient when diversification is working.
Putting it all together, we look at the current volatility and think this too shall pass. We appreciate the trust you put in our team and we will continue to share our unbiased opinions of what is really happening out there.
For more content by Ryan Detrick, Chief Market Strategist click here.
02354044-0824-A

