
“It is about time in the market, not timing the market.” Old investment saying
As of now, the S&P 500 has avoided officially entering a bear market (down 20% from the February 19th closing high), but who knows, by the time you read this we might be there. I’ll take a different approach today and look at some big picture things that all investors need to know.
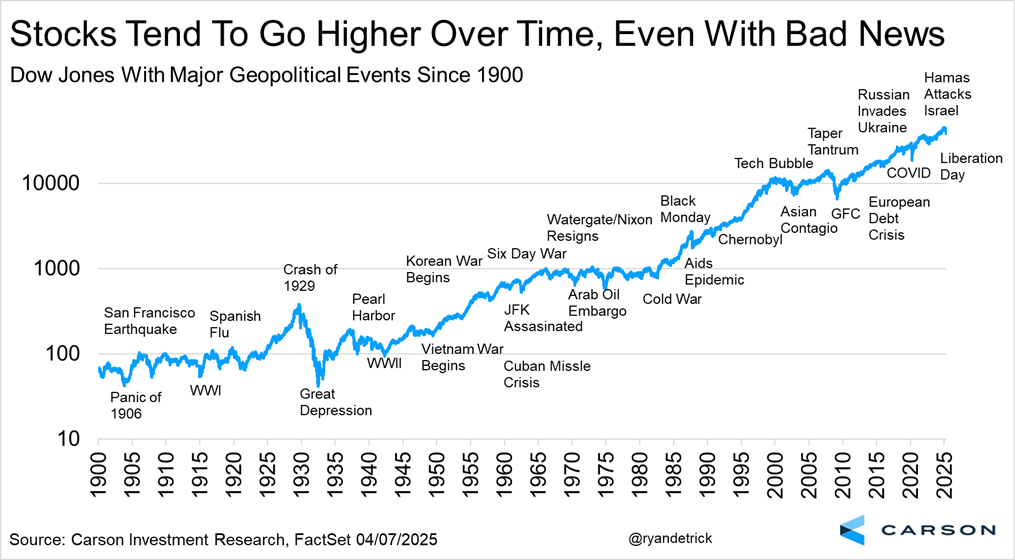
Stocks Can Go Up on Bad News
A lot of bad things have happened since 1900, yet the Dow has continued to move back to new highs after every single one of them. The truth is a lot of good things have happened throughout history too, but we usually don’t hear so much about those. As bad as the reaction has been to “Liberation Day” we don’t think this will be any different than the other bouts of bad news, as some day in the future new highs will very likely happen.
Bear Markets Happen, Even Outside of Recessions
The S&P 500 is down more than 17% from the February 19th peak, so we are one bad day away from moving into a new bear market. Does this mean a recession is right around the corner? As of now, we think we can avoid a recession this year, but the odds have unquestionably jumped the past few weeks. Still, looking at the past 18 bear (or near bear) markets we find that nine took place in a recession and nine didn’t, with the average bear down nearly 30% over those 18 times. The times a recession was avoided stocks fell about 24%, compared with bears in a recession down nearly 35% (but keep in mind that doesn’t include the times a recession didn’t see a bear market, which happens too). If we aren’t falling into a recession then the odds favor that this current weakness will be fairly contained near here.

Big Moves Are Normal
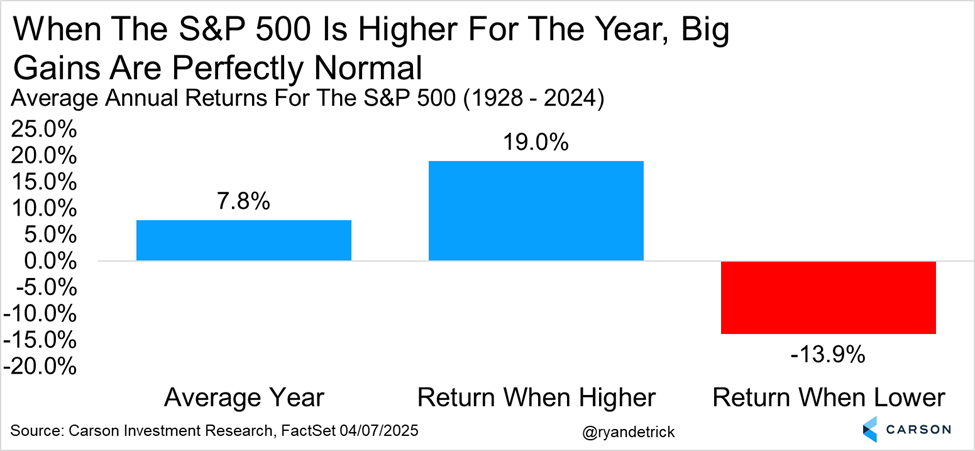
Looking at annual returns, when the S&P is positive it is up 19.0% on average, but when it is lower it averages down nearly 14% for the year. Those are some big moves. Think about that again. When stocks finish higher on the year they are up nearly 20% on average, likely way more than most investors expected I suspect. The flipside is when things are in the red a decline of nearly 14% is perfectly normal, so larger down years might not happen as often but they indeed can happen.
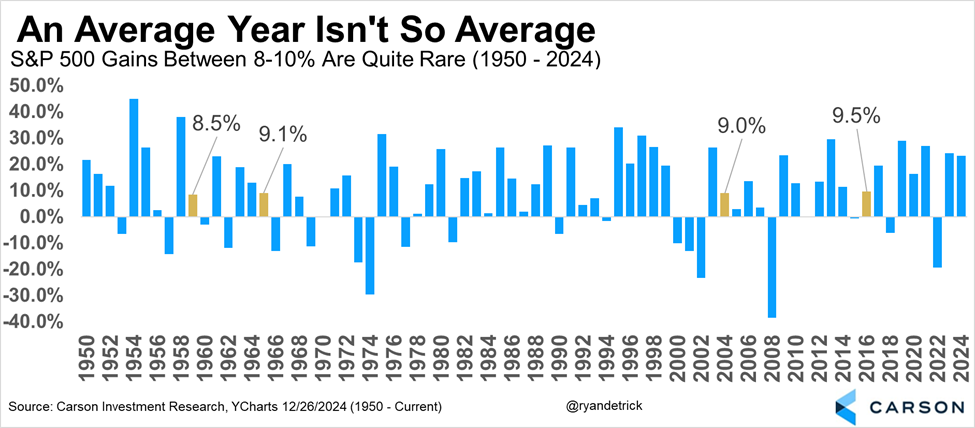
Average Isn’t So Average
Along the same lines as above, the average year for the S&P 500 gains 9.5% on average, but a gain around that average is extremely rare. In fact, only four times going back 75 years have stocks finished 8-10%. Just know that larger moves are quite common, whether those moves are up or down.
Corrections Are Normal
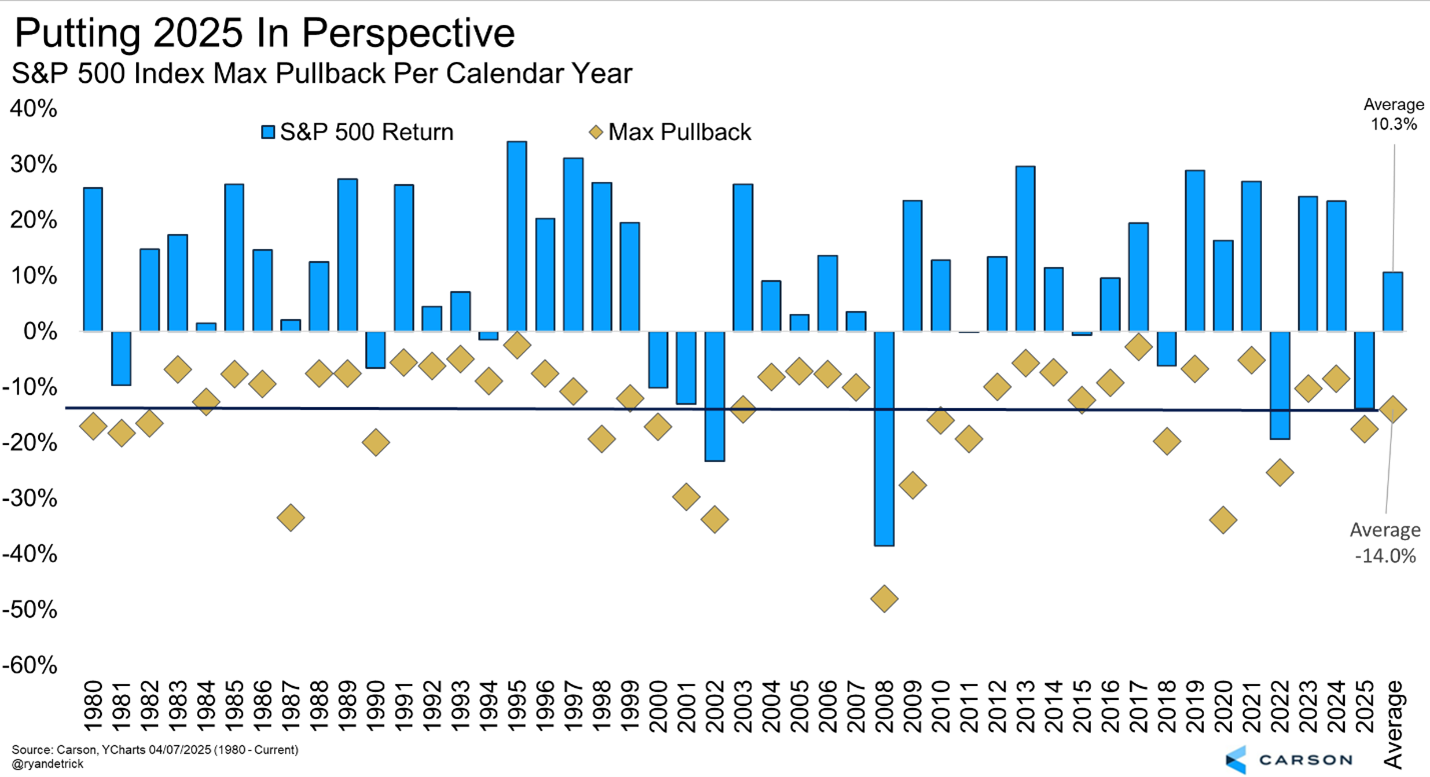
The current 17.6% correction sure feels like a lot, especially given we didn’t have a 10% correction all of last year, but it turns out this is more common than you think. Since 1980, we found the average peak-to-trough correction per year is 14.0%. Yes, this year has a long way to go and things could get worse, but don’t forget that with more time to go things could also get better.
Another Bear Now Would Be a Record
By the time you read this, we very well could be in another bear market, which would be the third bear market over the past five years. That would be the fastest we’ve ever seen three bear markets start, topping the just under seven years we saw for three bear markets starting from February 1966 to January 1973.

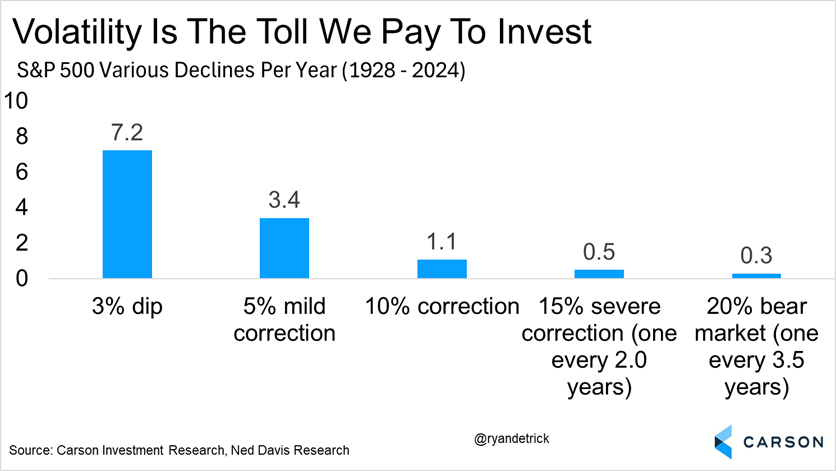
Volatility Is the Toll We Pay To Invest
If you’re read our blogs over the past few years, then this one shouldn’t be a big surprise. Yes, this year hasn’t been fun, but we like to say that volatility is the toll we pay to invest. Every single year will have some bad days and some scary headlines. In fact, on average you’ll see a 10% correction once a year, with a bear market every three and a half years. If you want the longer-term gains that stocks historically provide, you have to be willing to stomach some of the volatility and that is the toll we pay as investors.
February Peaks Are Rare
Can stocks really get back to new highs before this year is over? We get it, that would take a heck of a move, but we wouldn’t say the odds are as slim as many think. Should we get some good news on the trade front and the economy remans resilient it could happen. Then toss in the fact that only twice going back 75 has stock peaked in February and maybe we could see a new high later this year.

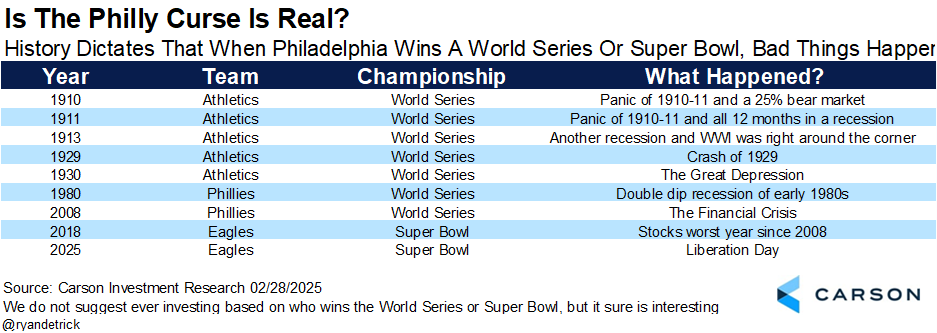
There Were Warning Signs
We noted this at the time, but the Eagles winning the Super Bowl was probably a very bad sign, as when the City of Brotherly Love wins a Super Bowl or World Series very bad things happen. Sure enough, ever since the Eagles won in February thing have been pretty bad. Full disclosure, don’t invest based on the Super Bowl, but boy oh boy this is interesting!
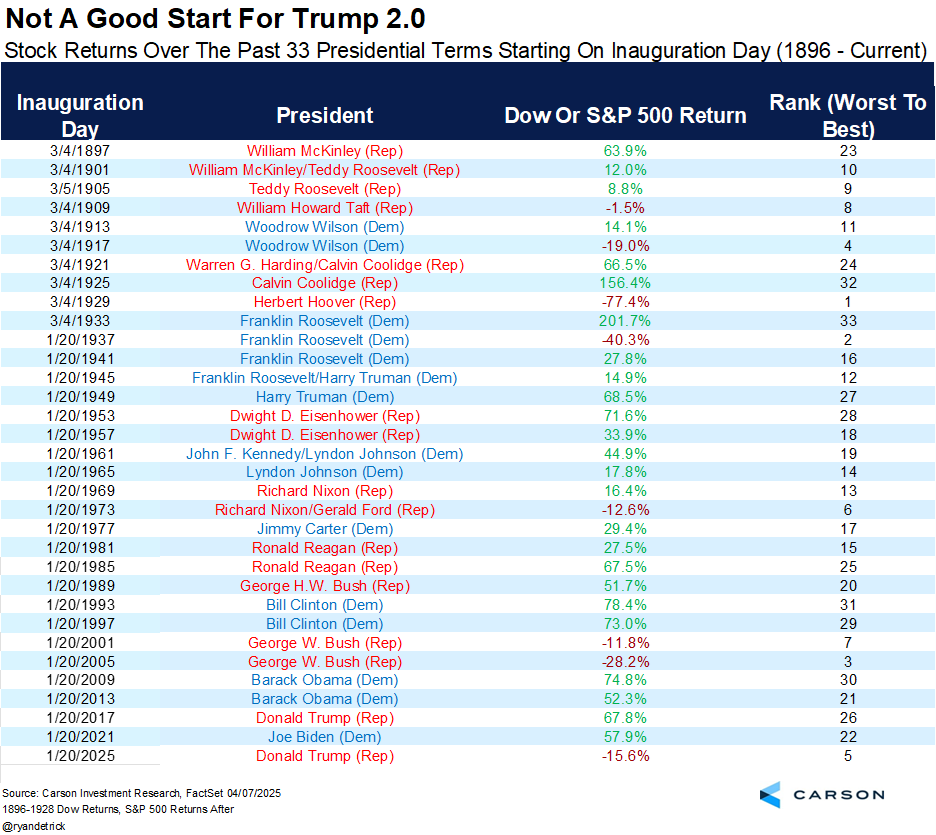
Rough Start for Trump 2.0
Speaking of bad returns, things haven’t done nearly as well in President Trump’s second term, or as I’ll call it Trump 2.0. The S&P 500 is down 15.6% since he took office and looking at the past 33 terms this is the fifth worst start out of all of them. Yes, there is plenty of time left for this to improve, but still, this isn’t a good start.
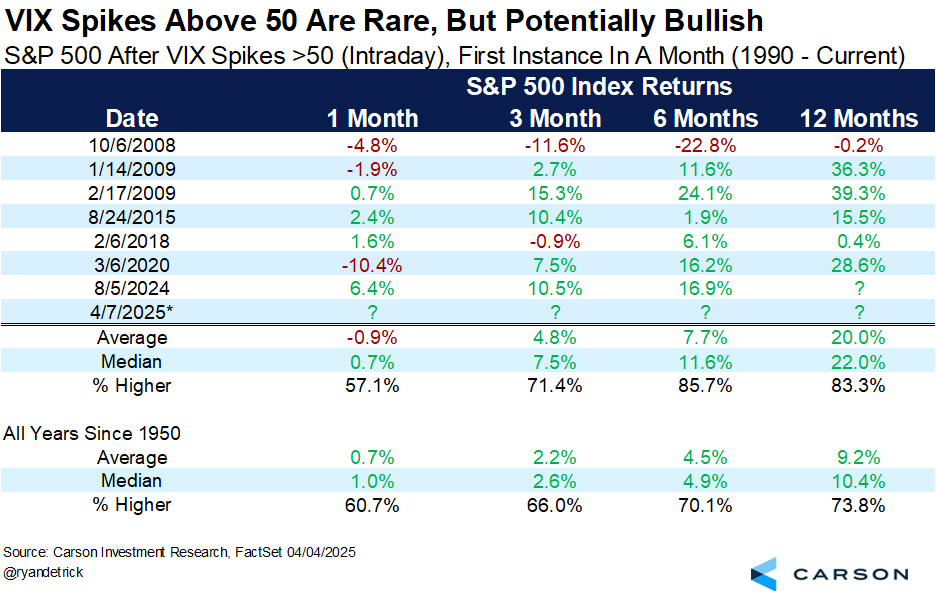
VIX 50 Is a Good Sign
The VIX soared to above 60 yesterday morning, hitting levels that historically have marked major bottoms for stocks. We’ll keep this simple, but when the VIX hits 50 for the first time in a month it has probably been preceded by poor performance driven by panic, likely suggesting better times are coming. In fact, the S&P 500 has gained more than 20% on average a year later after the VIX spikes above 50.
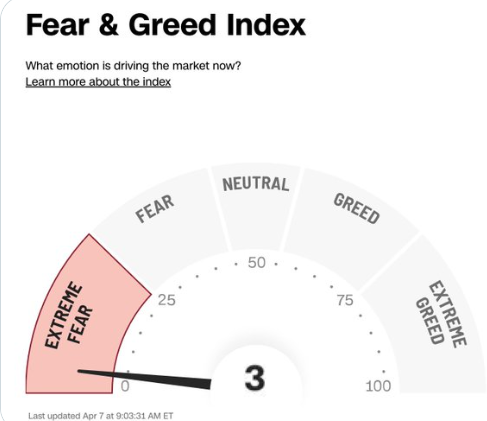
Adding to the pure washout levels of sentiment, the CNN Fear & Greed Index hit a level of three yesterday morning, about as low as it can go, suggesting many of the sellers have likely already sold.
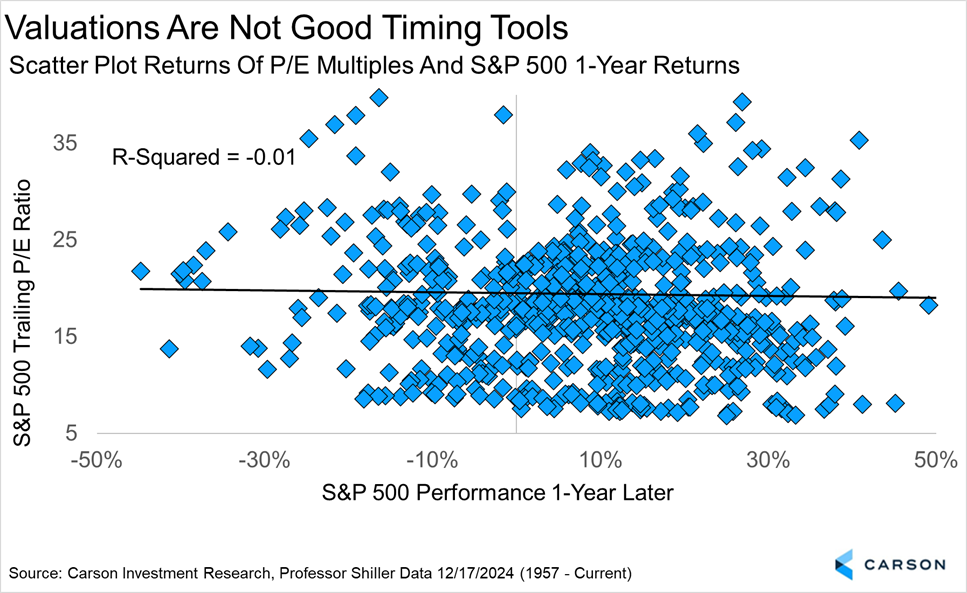
Valuations Matter, but Maybe Not as Much as You Think
We absolutely pay attention to valuations and the high valuations on technology is one of the reasons we didn’t come into 2025 overweight this group like so many others. Still, you might be surprised to find out there is virtually no correlation with P/E multiples and future stock performance over short time periods. We found S&P 500 trailing P/E multiples and one-year future returns have a correlation coefficient of virtually 0, suggesting there is no correlation between the two.
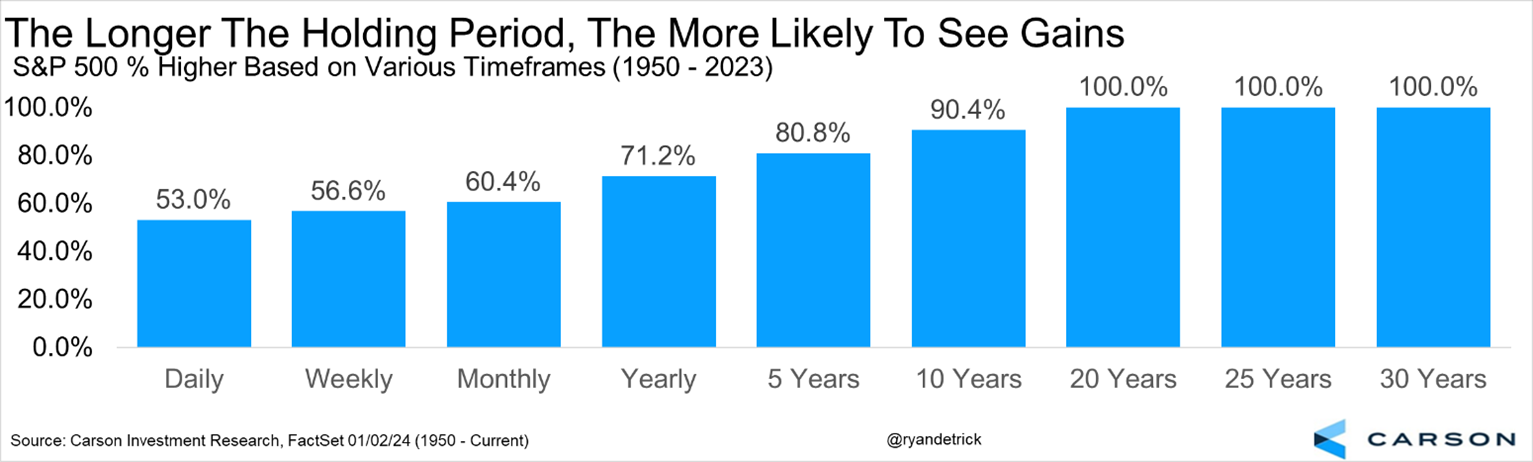
Time in the Market
Our advantage as investors is time. Let the hedge funds and algos fight over the day-to-day volatility, we can take a longer-term approach to things. Doing this shows that it isn’t about timing the market, but about time in the market. Yes, you’ve likely seen portfolio losses the past seven weeks, but if you have a long enough time horizon and you’re invested in line with your risk tolerance you were prepared to weather the storm for the potential of longer-term gains. As we show below, over the long run you’ll likely make money investing and knowing this is the big advantage you have over the crowd.
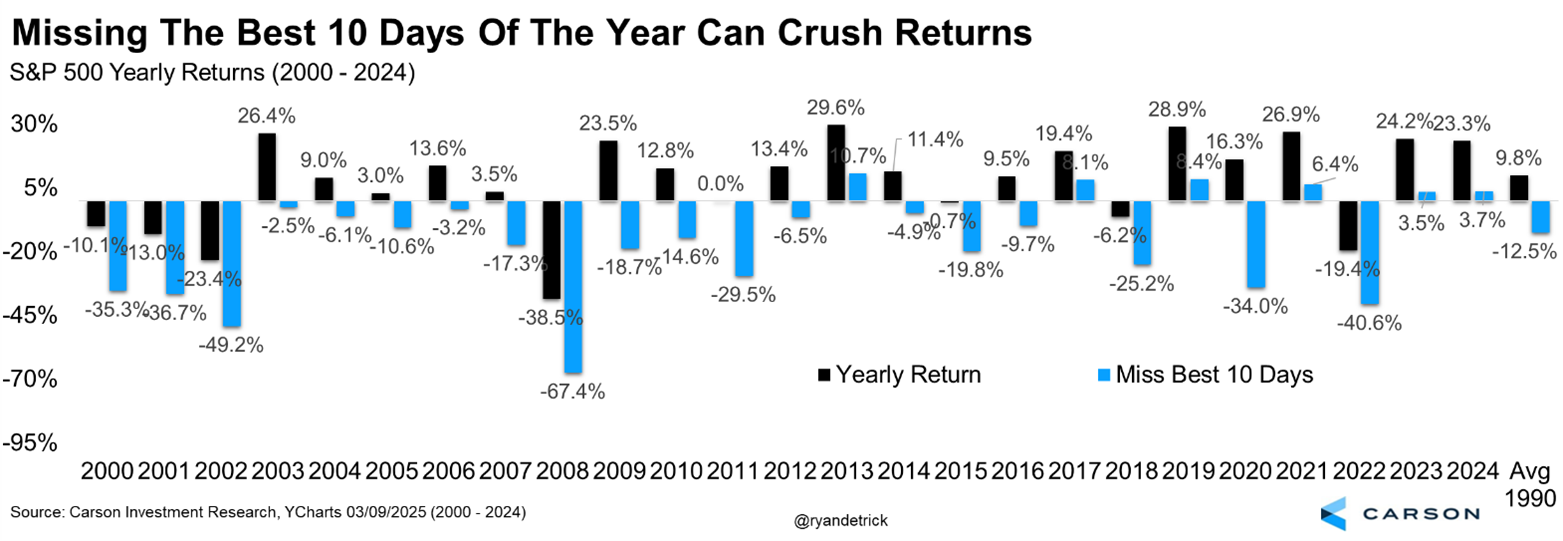
Missing the Best 10 Days
Along the lines of above, if you panic and sell at the lows then you’ll miss out on the rebound. We’ve done the work and we’ve found that the worst days of the year happen right around the best days of the year. So if you can’t take the bad days we’ve seen lately and sell, you’ll inevitably miss the upcoming best days on the rebound, which is very difficult to time. Here we show what happens if you miss the 10 best days of the year and the bottom line is since 2000 the average year has gained 9.8% but that drops to -12.5% if you miss the best 10 days each year.
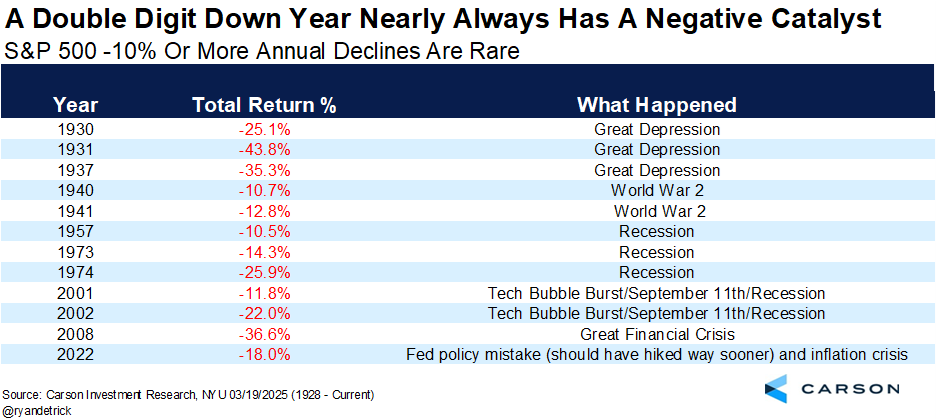
Double Digit Down Years Are Rare
The S&P 500 is down 13.9% on the year and no one is very happy about that, but does that mean the year will close down from here? As of now, we think the odds greatly favor stocks to finish the year higher than where they are now, likely a good deal higher with any good news. In fact, for the year to lose 10% it usually takes some really bad news. As you can see in the table below, double digit yearly declines nearly always have a major catalyst and we’ve only seen four of them since the turn of the century. Yes, tariffs could be the driver for this to happen this year, but time will have to tell there. For now, we’d side with a double-digit decline in 2025 likely being a low probability event.
There’s a lot happening out there and we know you can get your research from many places, but we are honored you are looking to us for guidance. We won’t always be right, we won’t always be wrong, but we will always be honest, while sharing actionable and easy to digest data. Thanks for reading and here’s to manifesting some green out there soon!
Stay on Top of Market Trends
The Carson Investment Research newsletter offers up-to-date market news, analysis and insights. Subscribe today!
"*" indicates required fields
For more content by Ryan Detrick, Chief Market Strategist click here.
7834150.1-0425-A