
Every quarter the New York Federal Reserve releases its household credit and debt report and we get a flurry of headlines about rising credit card debt, and rising delinquencies. As always with these things, it’s important to maintain some perspective.
One: Household Leverage is Actually Reducing
Credit card debt rose 3.9% last quarter (Q4 2024) to $1.2 trillion. Yikes! But credit card debt is under 7% of overall household debt. Total debt rose just 0.5% in Q4 to $18.0 Trillion, the slowest quarterly increase since Q2 2023. That’s because most of the debt is mortgage debt ($12.6 Trillion), and that’s barely increasing – for obvious reasons, since mortgage rates are running close to 7%.

But you know what’s increasing? Disposable income, which increased 1.3% in Q4. Across 2024
- Overall household debt grew by 3%
- Disposable income grew by 5%
In some ways, that’s what driving the economy, i.e. income growth, even as households become less levered. For perspective, here’re the numbers for 2019:
- Overall household debt grew by 4.4%
- Disposable income grew by 2.7%
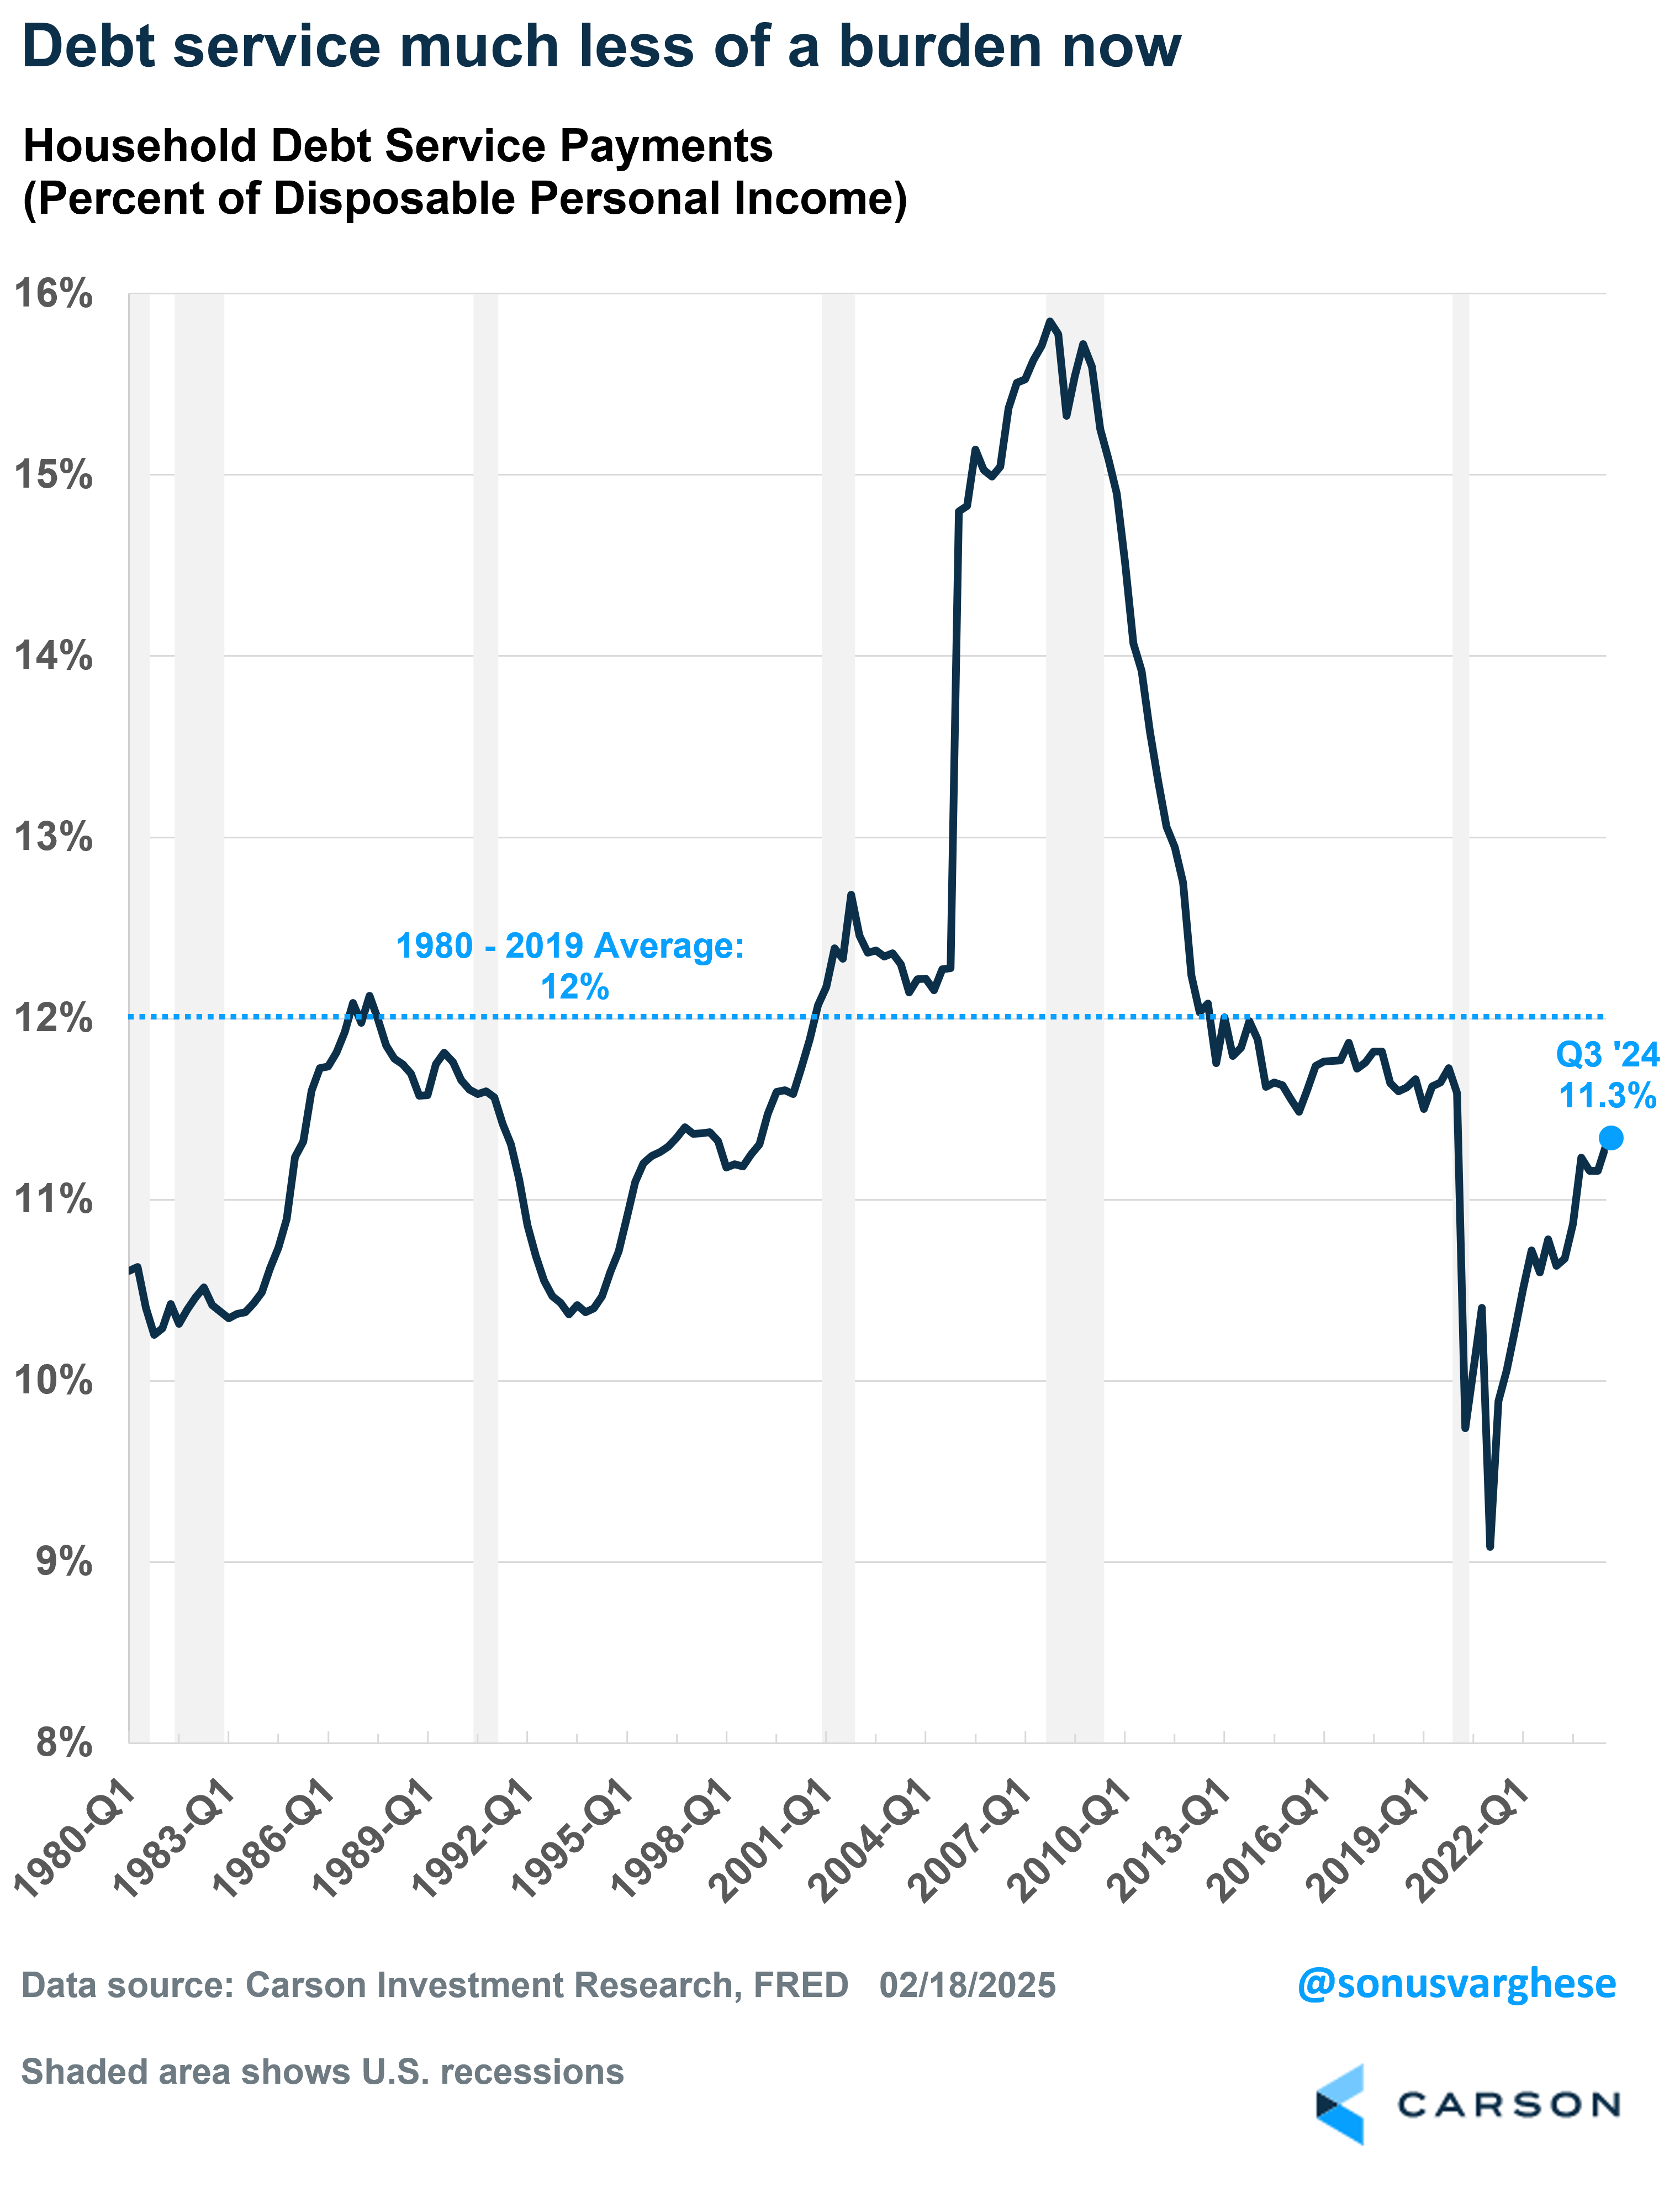
It’s remarkable that disposable incomes have grown faster than overall debt for the second year in arow (2023 and 2024). Where that becomes important is that disposable income is what is important for servicing the debt. Debt service payments are just 11.3% of disposable income right now, below the 1980-2019 average of 12%, and even below the 2019 average of 11.7%. Also remember that 2019 was the end of a decade of deleveraging. Household balance sheets got hit by the Financial Crisis, as stock prices and home prices fell, and spent the following decade rebuilding that. So, debt service running below 2019 levels is a huge positive.
Two: Consumers’ Borrowing Capacity Is Not Stretched
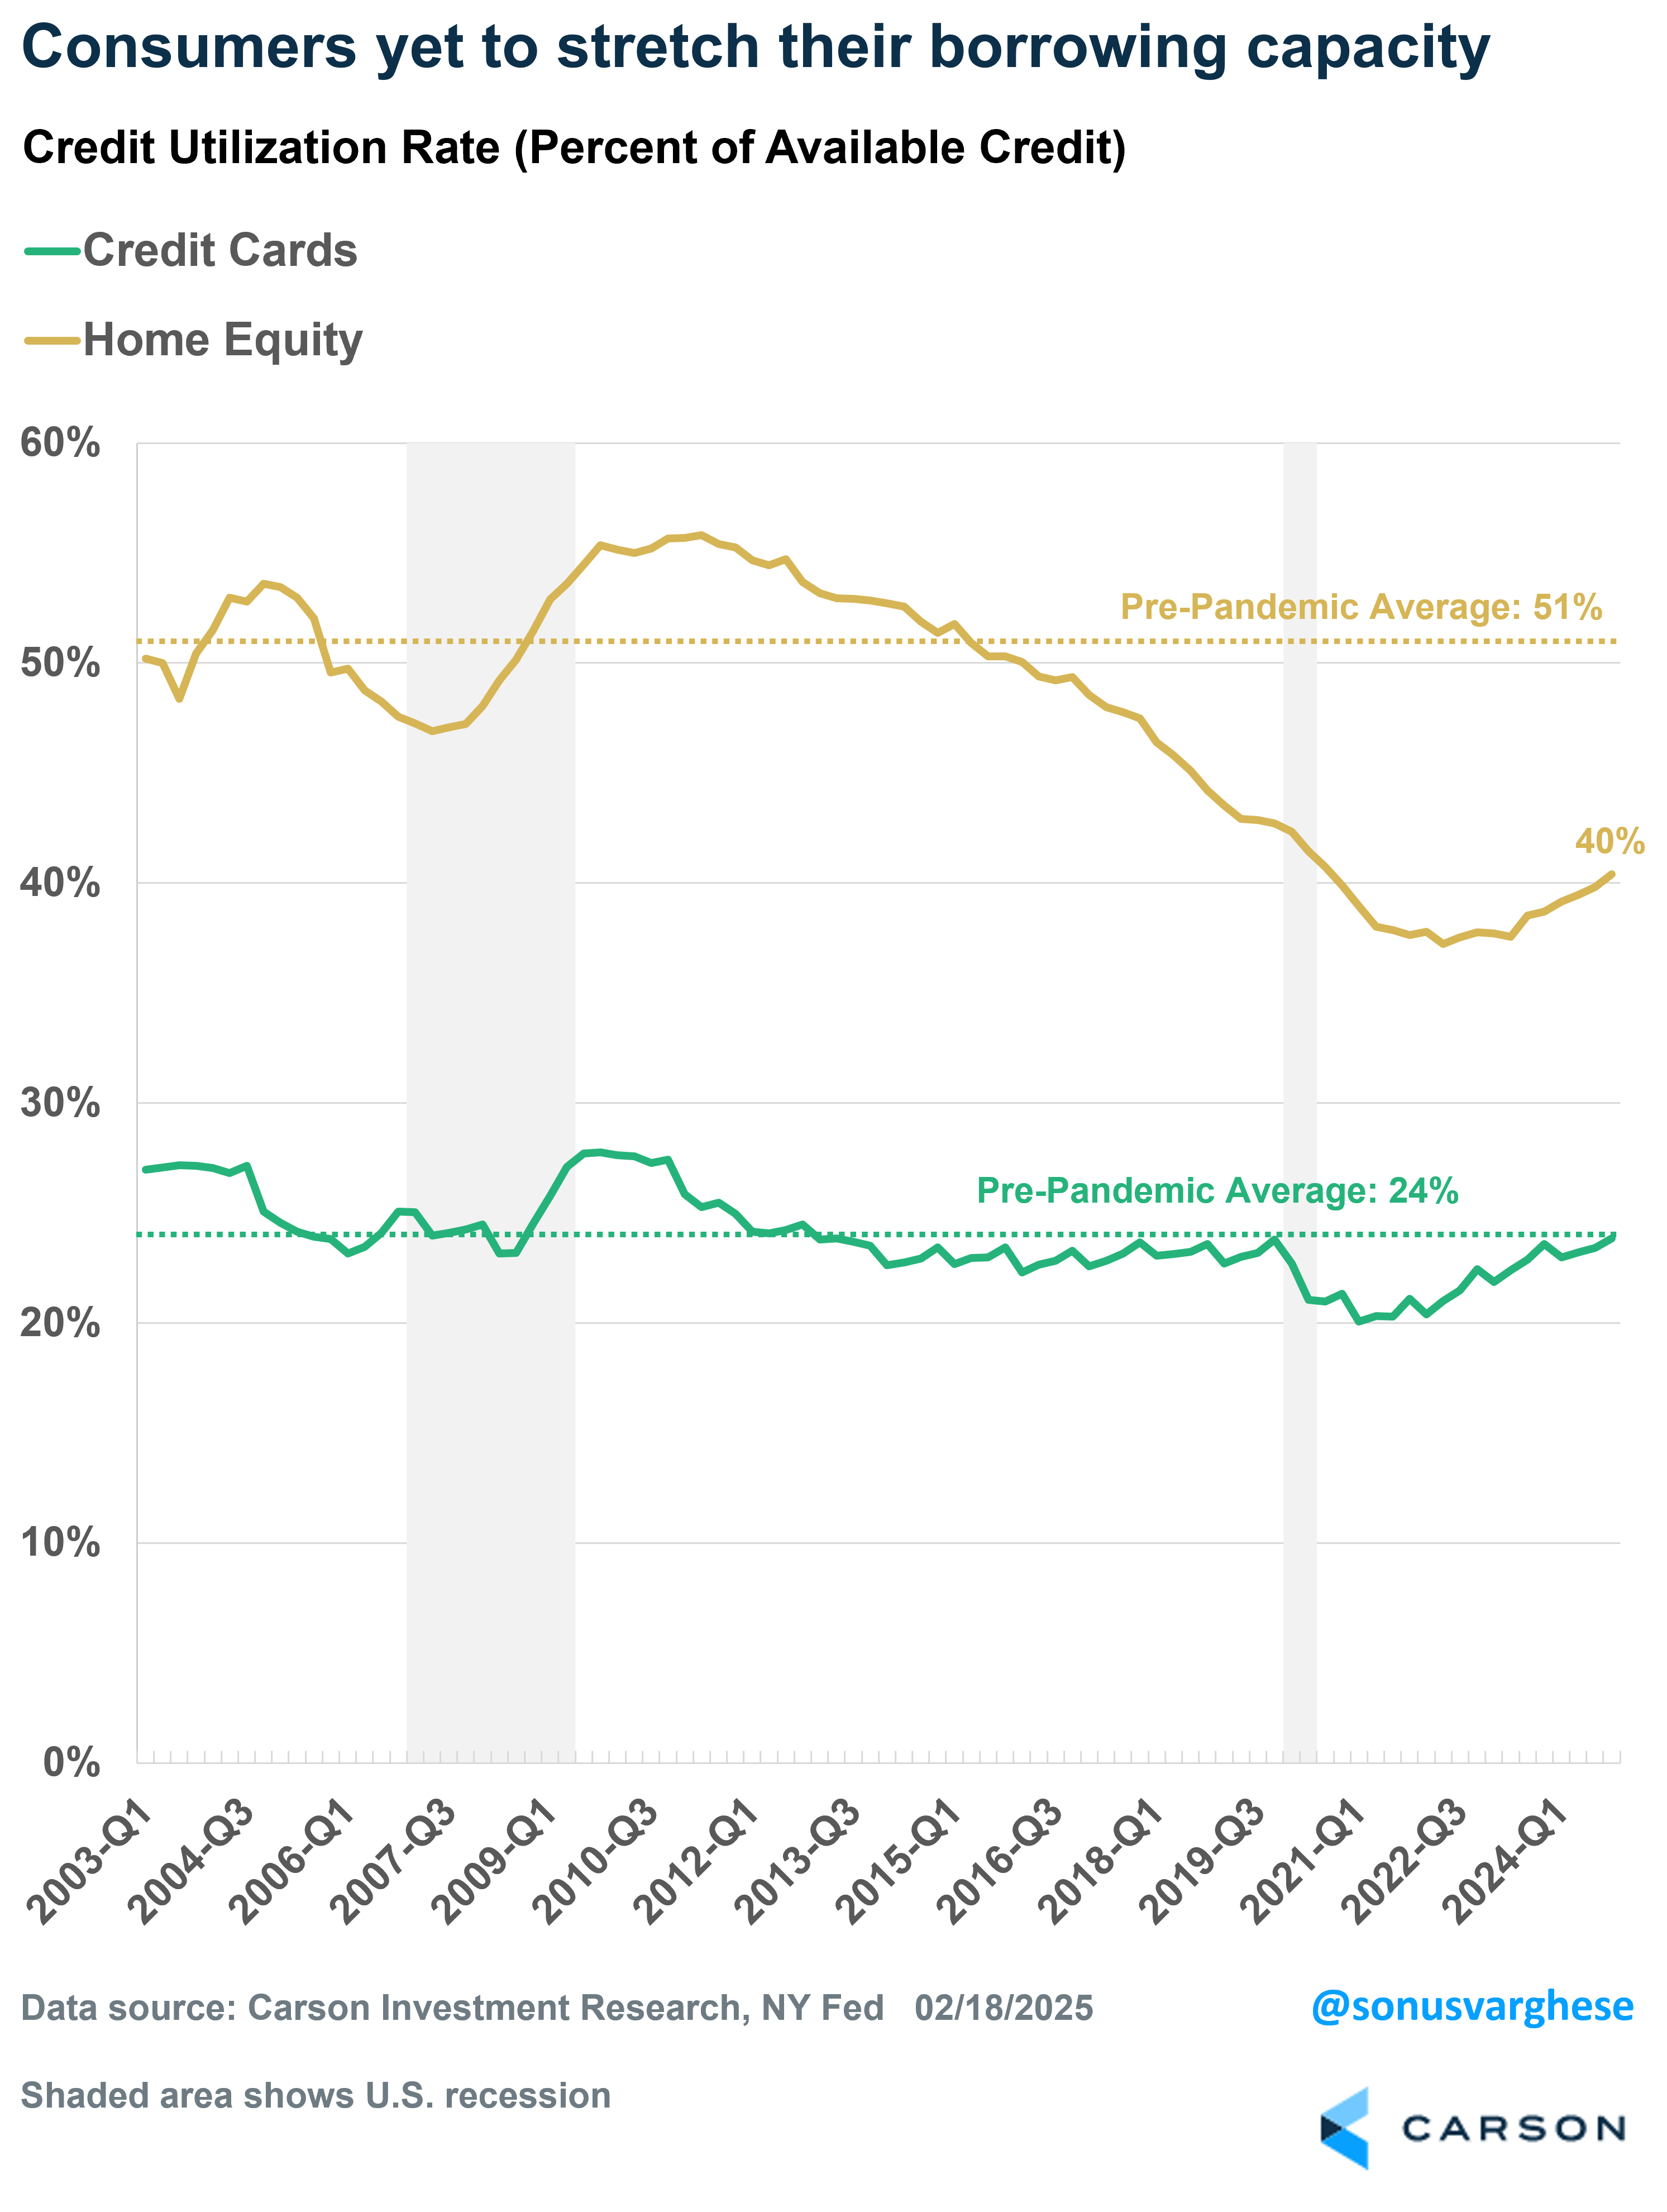
Credit card debt rose by $45 billion in Q4 (to $1.2 trillion). However, credit card limits rose by $98 trillion, which means available credit rose by $53 billion, more than the increase in credit card debt. As a result, credit card utilization was unchanged at 24%, matching the 2010-2019 average.
Stay on Top of Market Trends
The Carson Investment Research newsletter offers up-to-date market news, analysis and insights. Subscribe today!
"*" indicates required fields
Home equity credit utilization was also unchanged at 40%, which leaves it well below the historical average of 51%. This in my mind is the main dry powder consumers have, and likely to increase as home prices rise. Of course, we need interest rates to pull back for consumers to start accessing this dry powder, but it’s there.
Three: Credit Card Delinquencies Rose, But This Is Likely Normalization
There’s been a lot of worries about rising stress within credit cards and auto loans. Looking at the percent of balances that were 90+ days delinquent:
- Credit cards: Rose from 11.1% to 11.4% (it was 8.4% in 2019)
- Auto loans: Rose from 4.6% to 4.8% (it was 4.9% in 2019)
The data for “transition” into serious delinquencies (90+ days) is where a lot of concern has focused:
- Credit cards: Rose from 7.1% to 7.2% (it was 5.3% in Q4 2019)
- Auto loans: Rose from 2.9% to 3.0% (it was 2.4% in Q4 2019)
Now, the transition rate is the newly added seriously delinquent balance as a percent of the previous quarter’s balance that was not seriously delinquent. But with debt balances running relatively on the lower side, it doesn’t take a lot of new delinquencies to send the transition rate higher. Ultimately, incomes are funding consumption, so fewer people are using debt (especially credit cards) to fund consumption. So, the mix of borrowers is slightly worse.
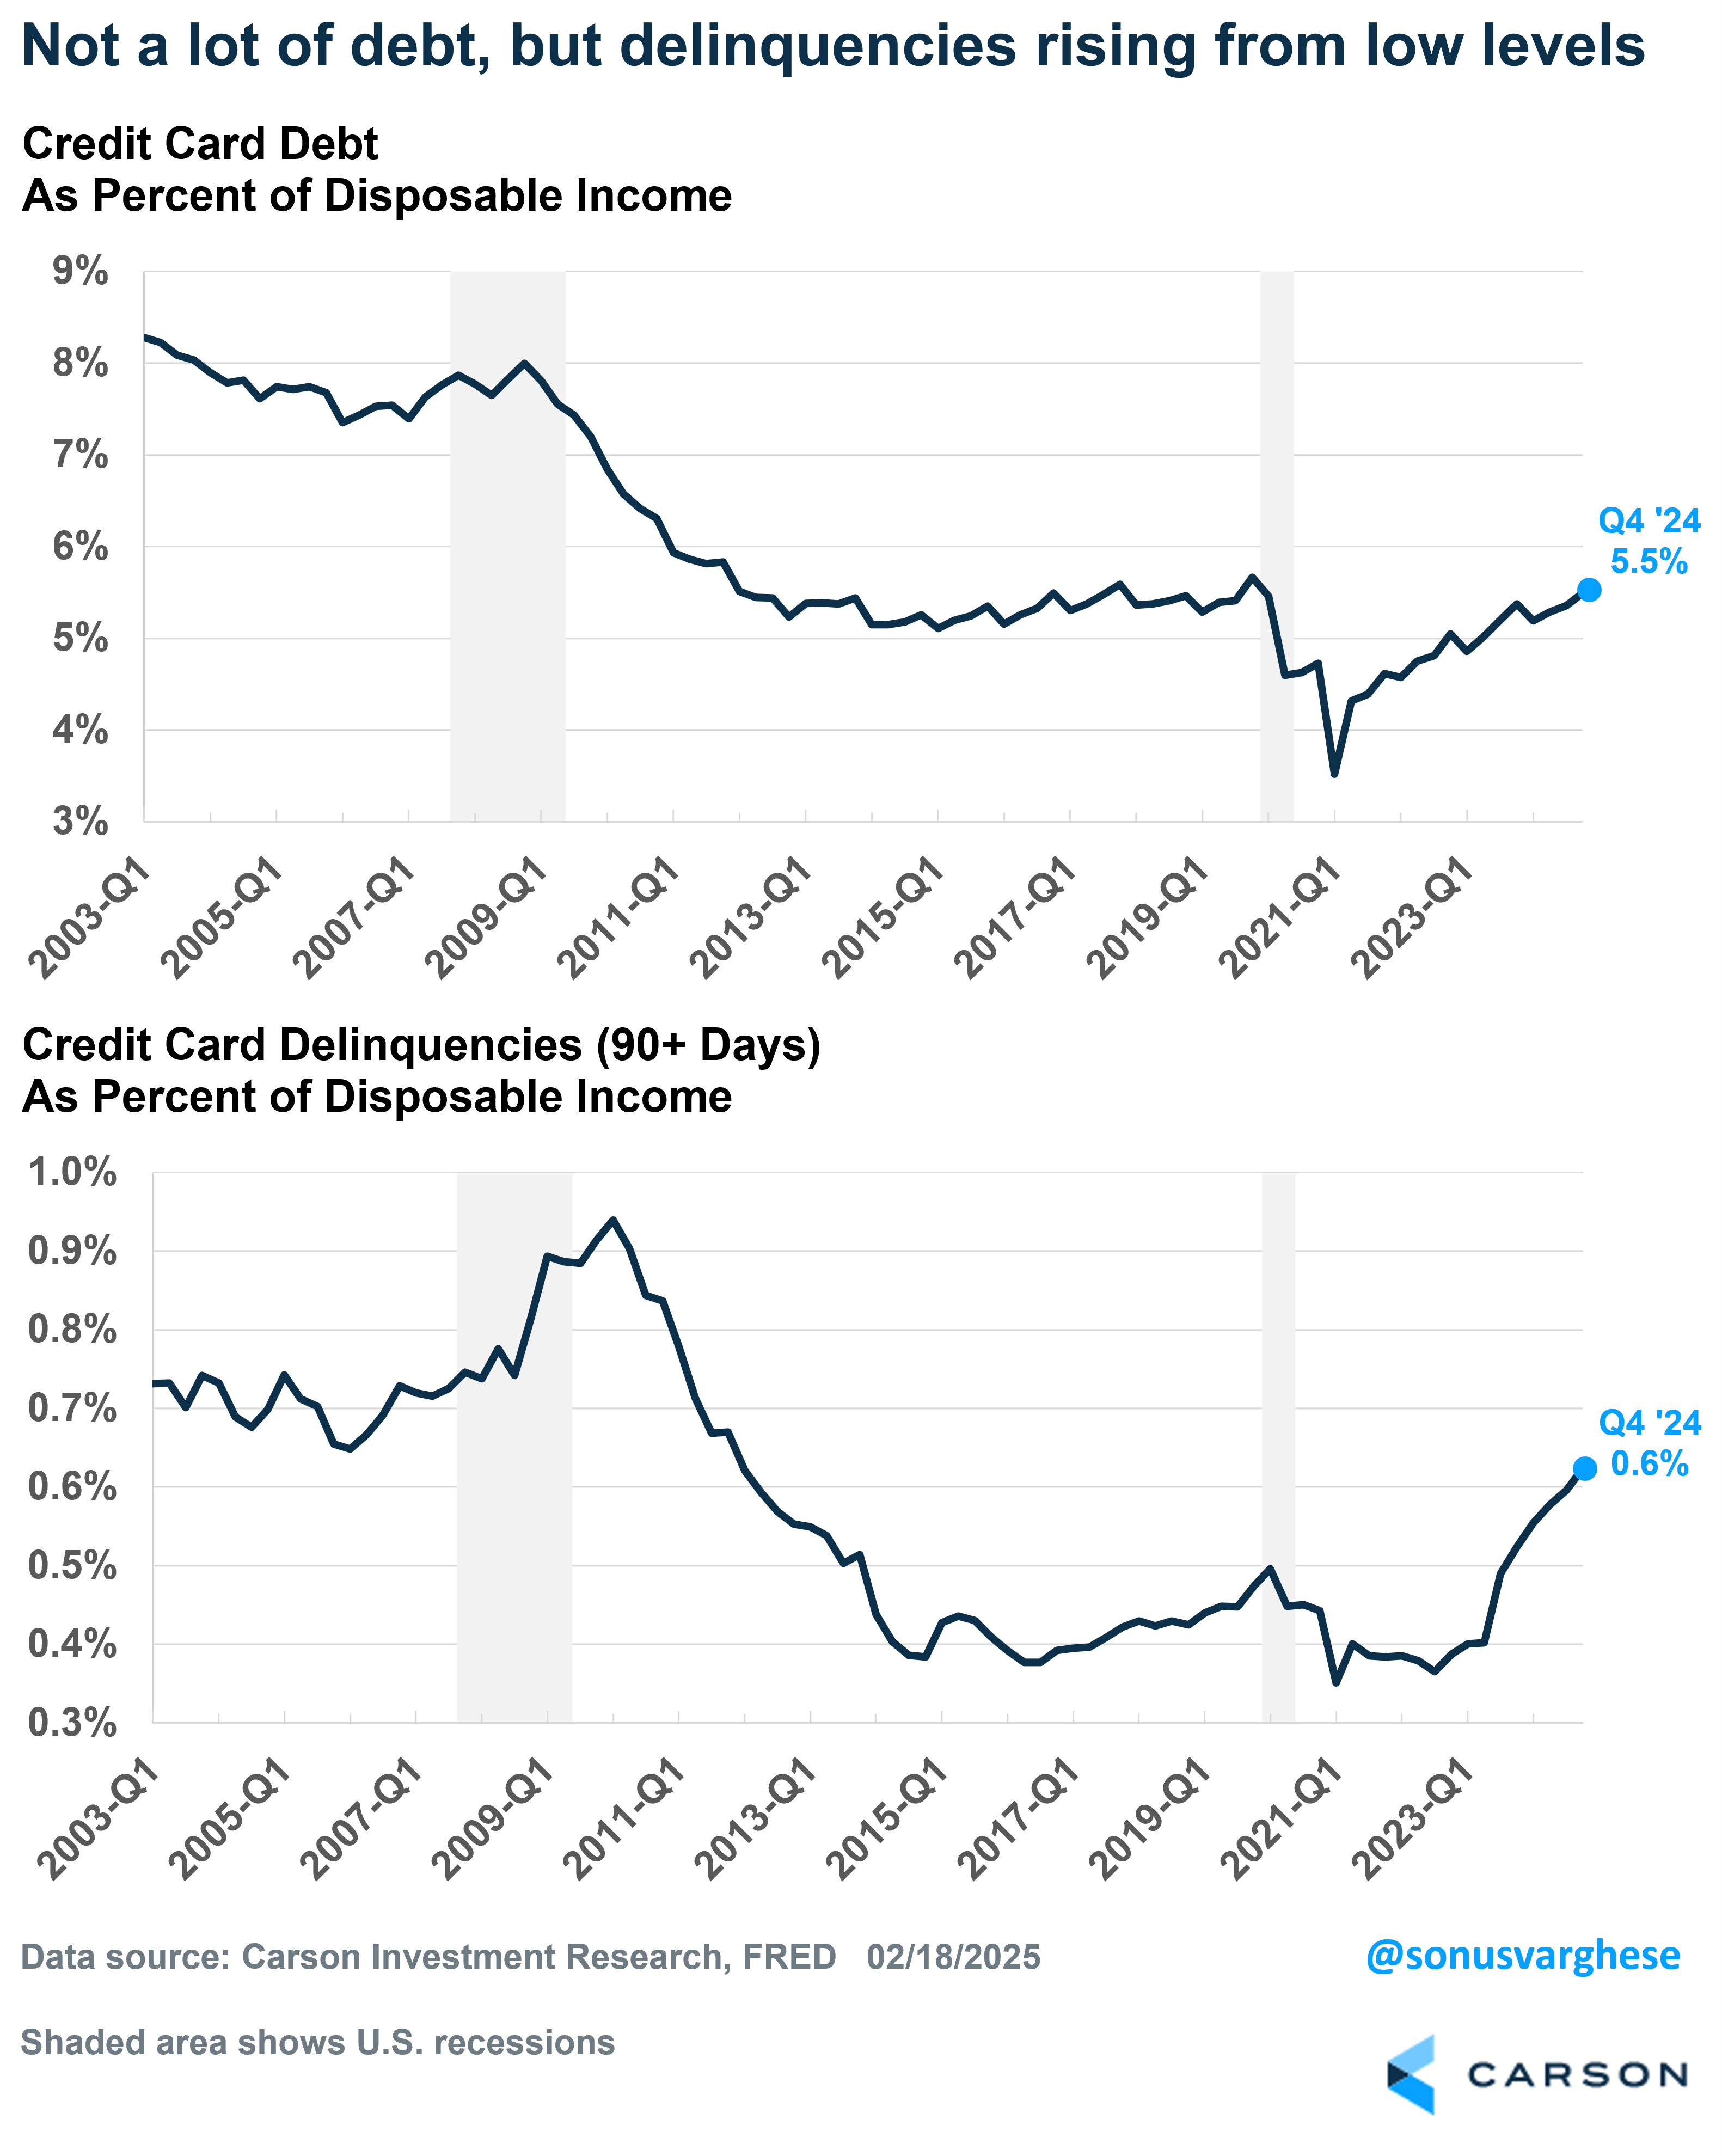
Again, it’s better to normalize delinquencies and transitions into delinquencies by disposable income, to help comparisons across time on an apples-to-apples basis. Credit card debt is current around 5.5% of disposable income, slightly lower than the 5.7% in 2019 and below the historical average of 6.4%. Meanwhile, card balances that are seriously delinquent (90+ days) is 0.62% of disposable income. That’s up from 0.52% a year ago, and currently higher than pre-pandemic levels. However, it’s lower than the minimum we saw during the 2003-2007 expansion cycle. As I pointed out above, households were in a big deleveraging cycle during the 2010-2019 period, as they looked to shore up their balance sheets. Balance sheets are much more solid now, and so what we’re seeing is likely just normalization. If it continues to surge, that would be worrisome, but there’re already signs that the rate of growth of delinquencies (relative to incomes) is starting to slow down.
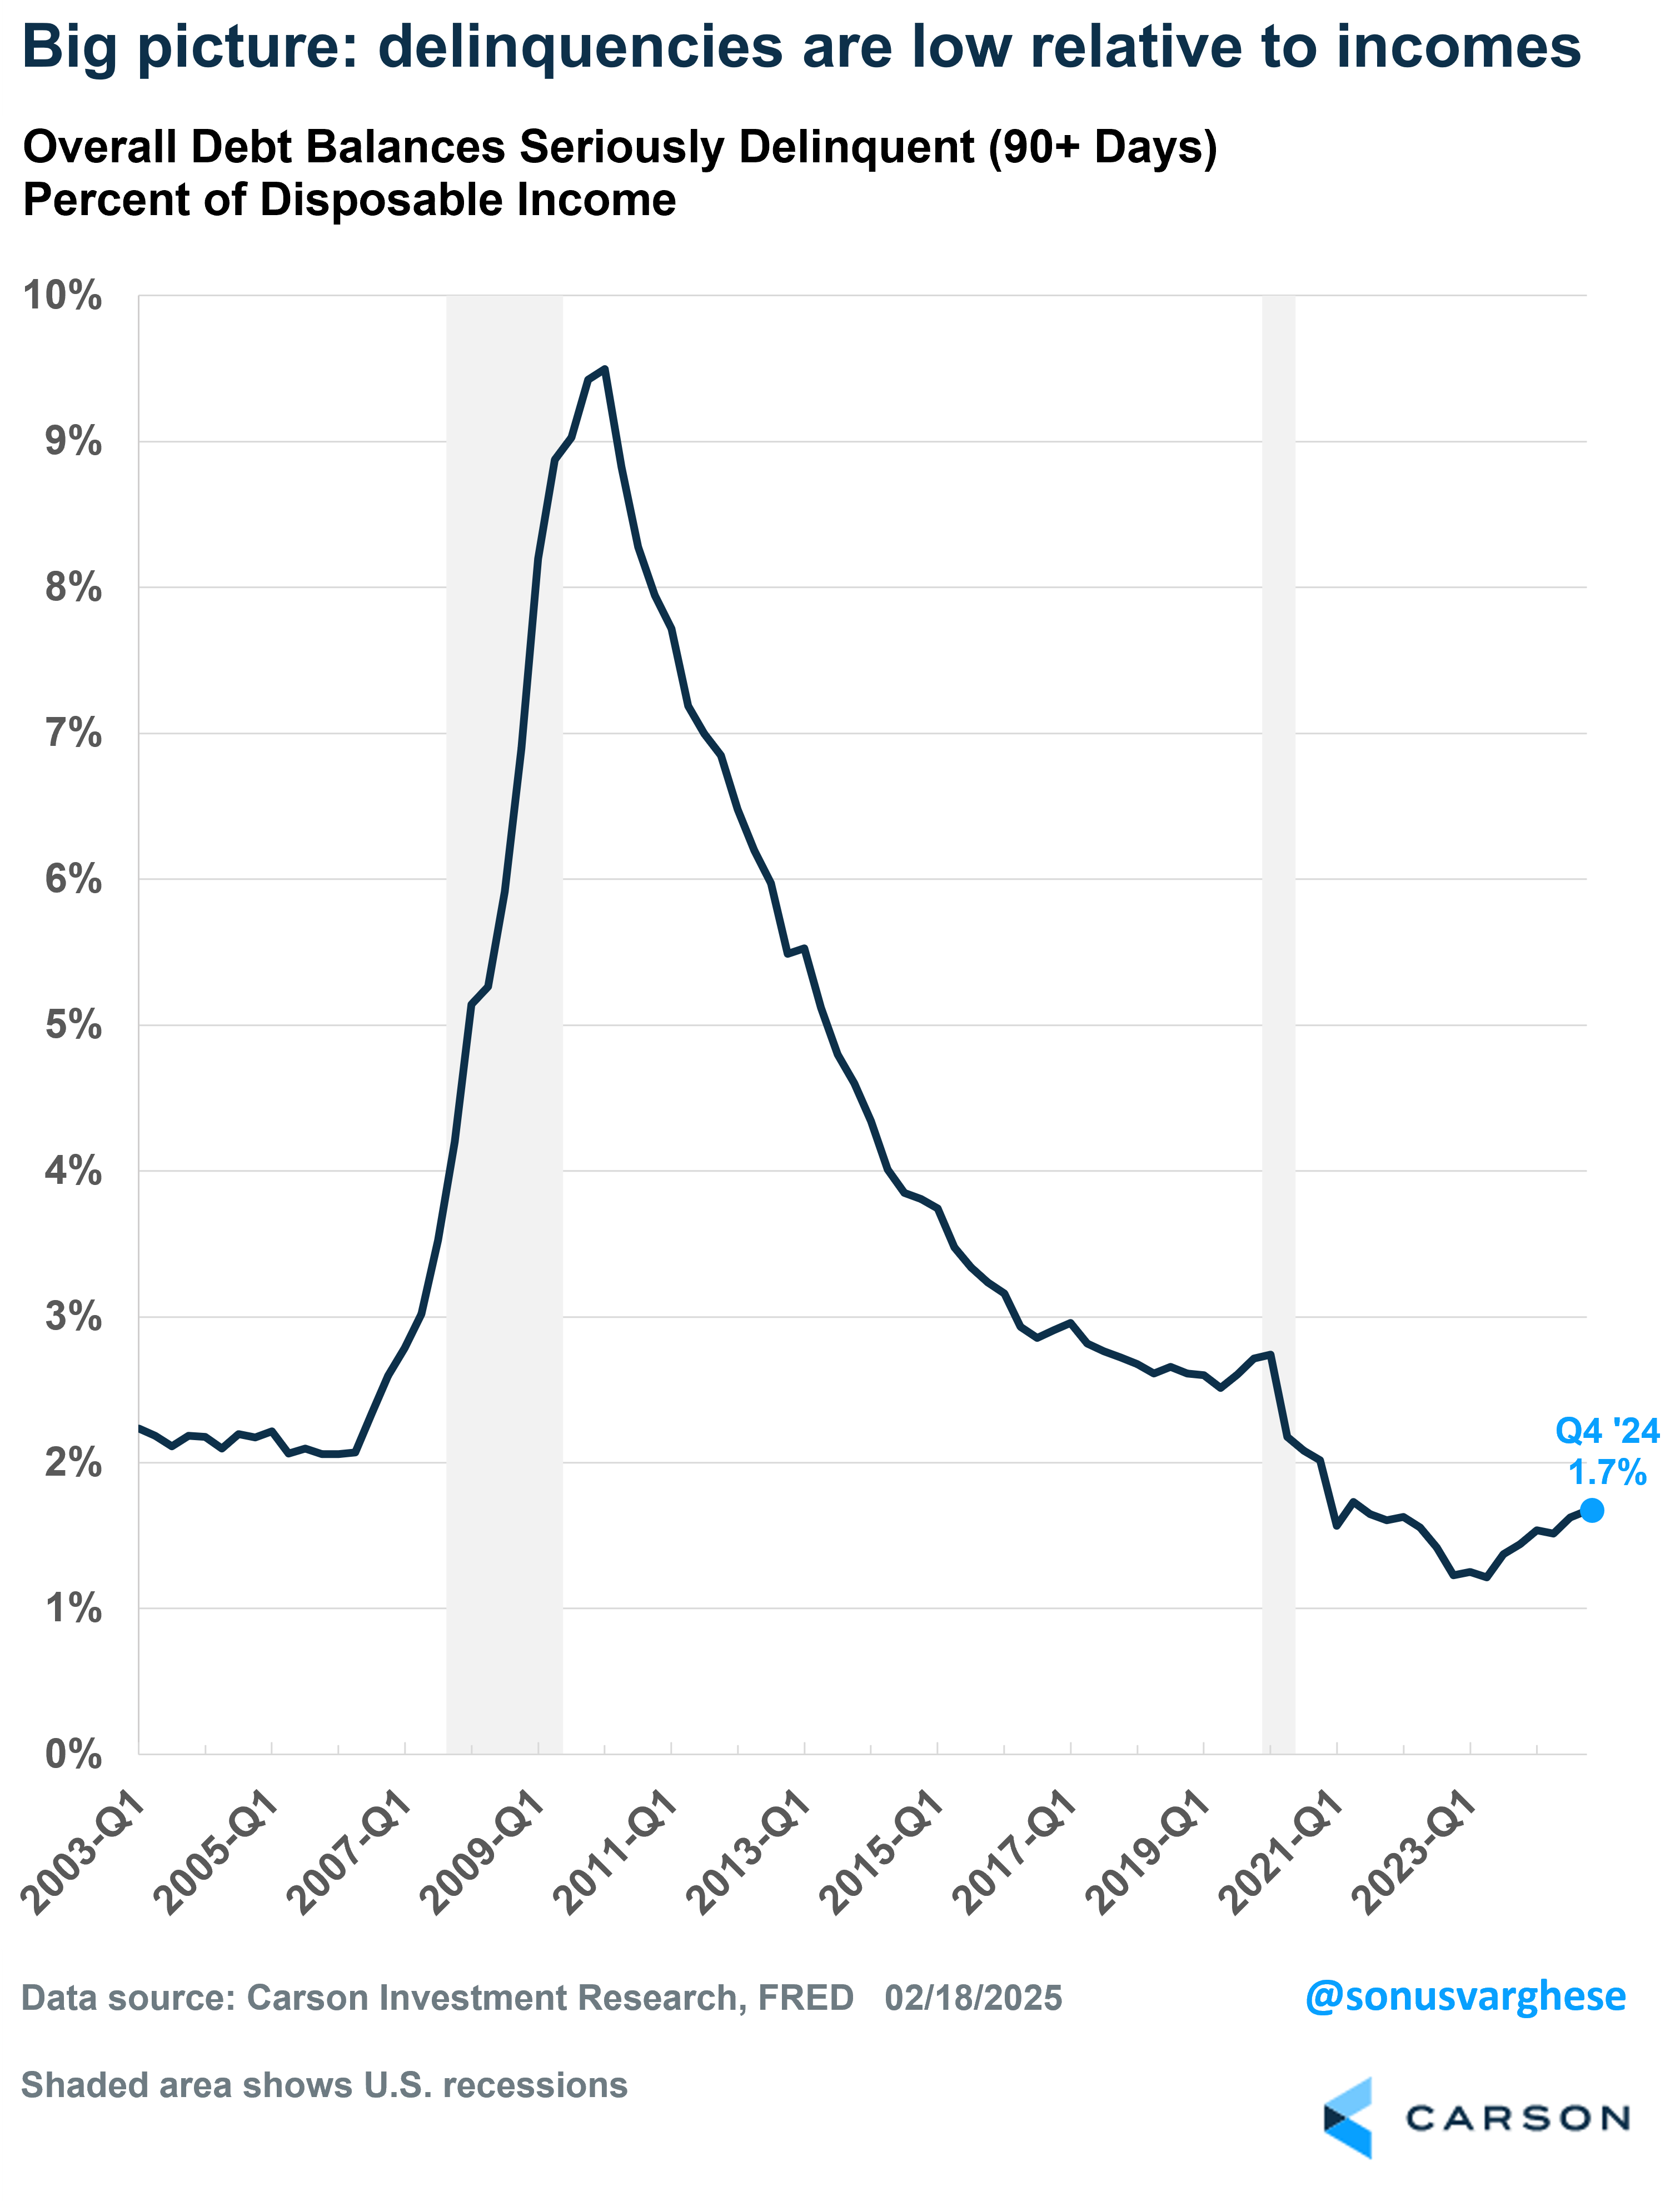
Four: Overall Picture of Delinquent Balances Don’t Look Bad
Let’s look at the overall picture of delinquent balances. The percent of total balances that were current on payments fell slightly from 96.5% (Q3) to 96.4% (Q4). That’s above the Q4 2019 level of 95.3%. What is especially striking is if you look at “seriously delinquent” balances (anything above 90 days – that’s just 2% of total balances, versus 3.1% in 2019.
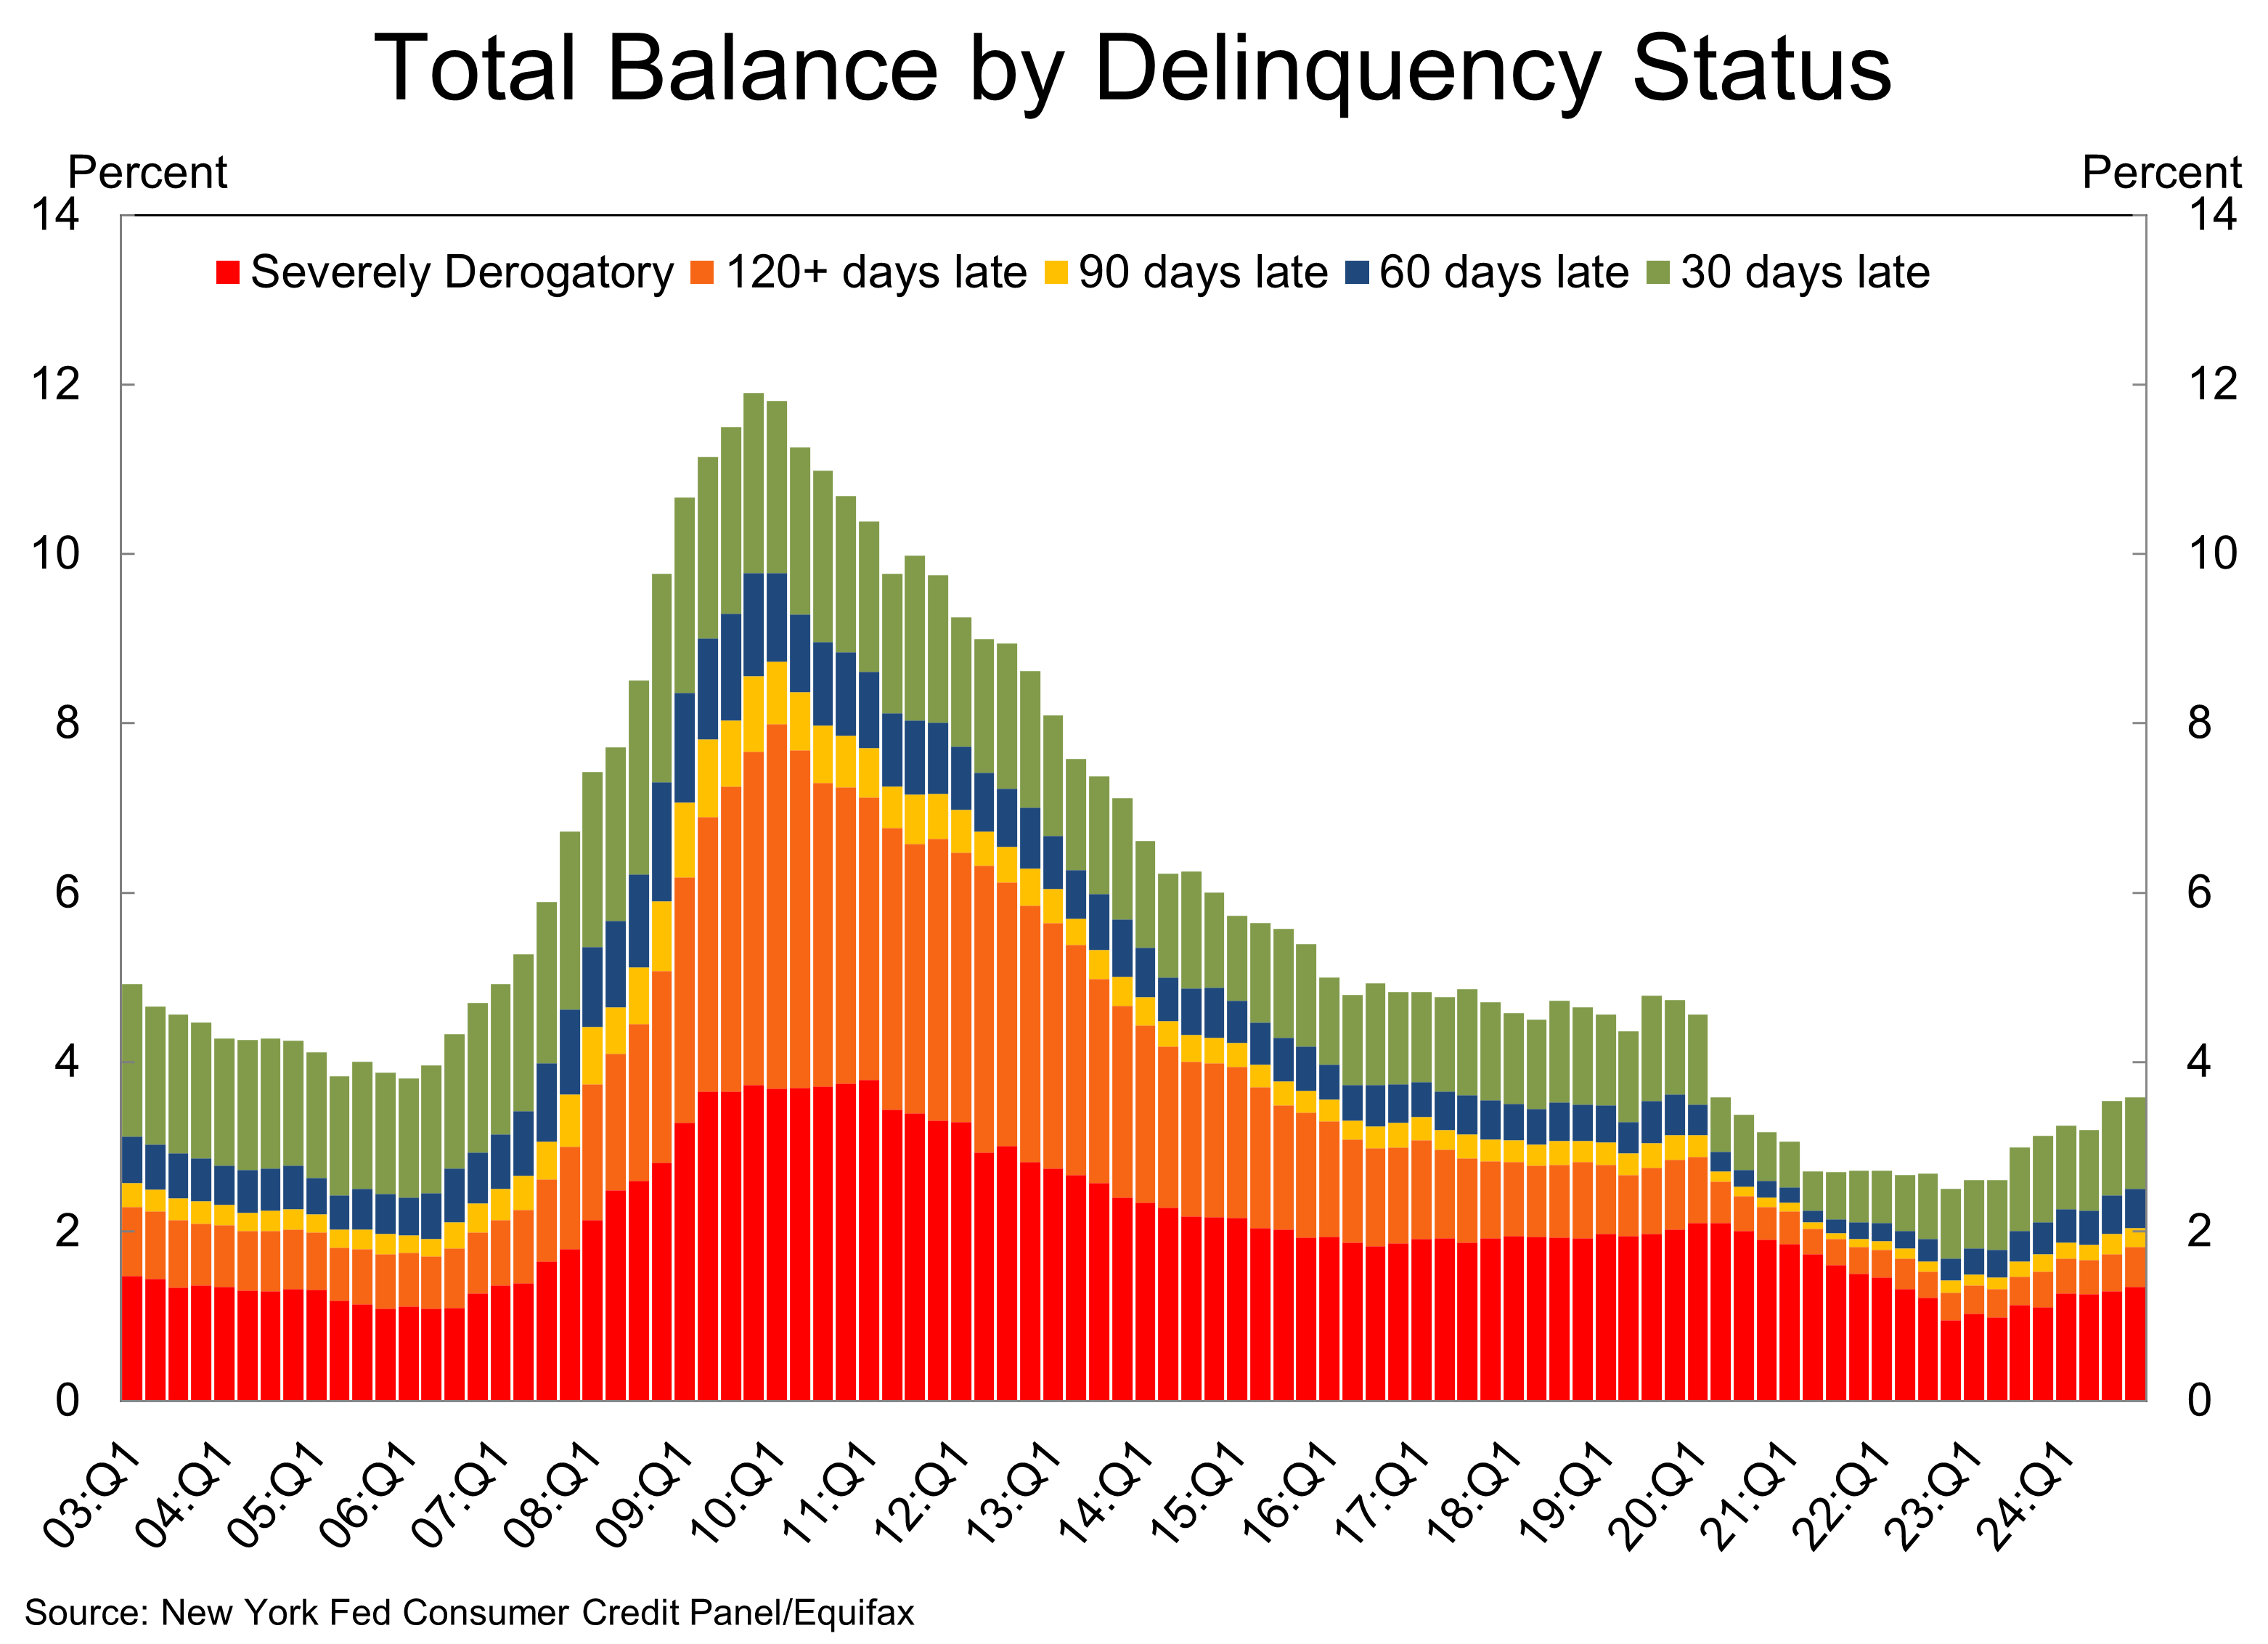
Again, once you normalize by income, the picture looks even better relative to history. Seriously delinquent balances are just 1.7% of disposable income. It was 2.7% in 2019, and averaged 2.2% from 2003-2006. This is probably the chart that best illustrates the post-Financial Crisis deleveraging cycle of 2010-2019.
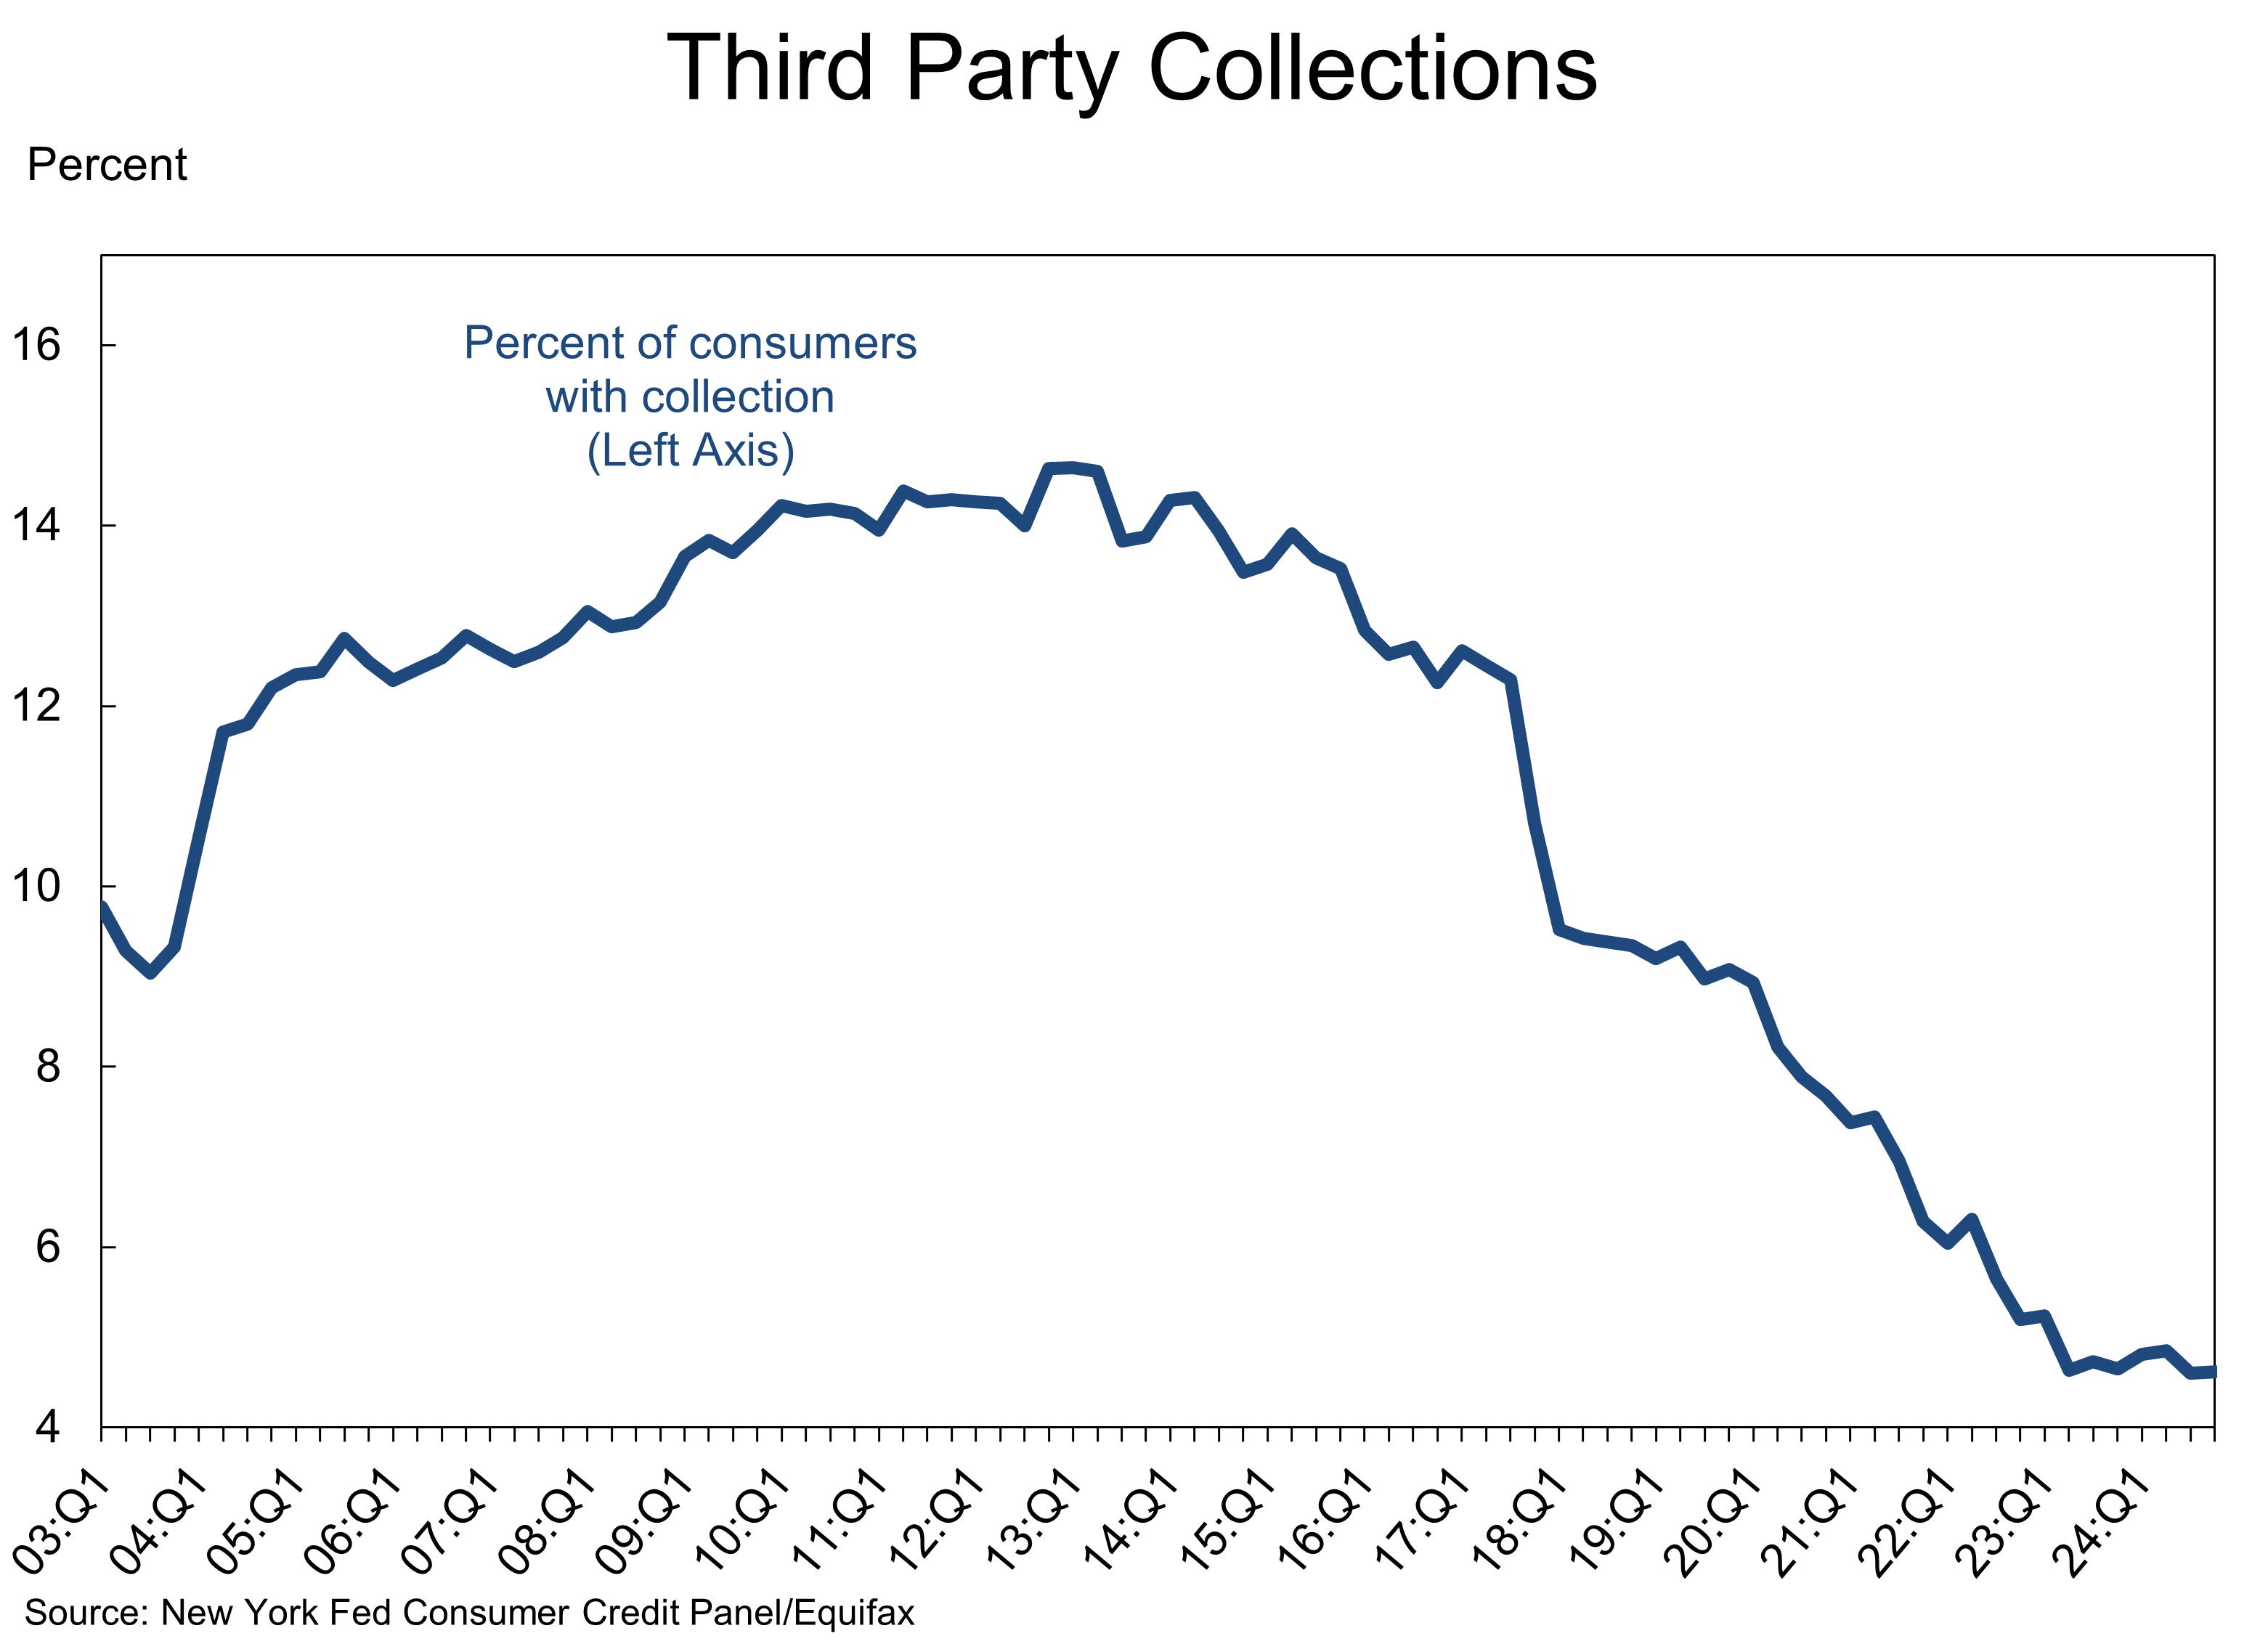
Five: Collections, Bankruptcies, and Foreclosures Are Running Low
If households were really getting stretched, and there was a lot of payment distress even amongst certain broad pockets, we would see third party collections soar. It’s the opposite. Only 4.6% of households had collections against them in Q4, and that’s actually lower than 4.7% a year ago. It averaged 9.2% across 2019.
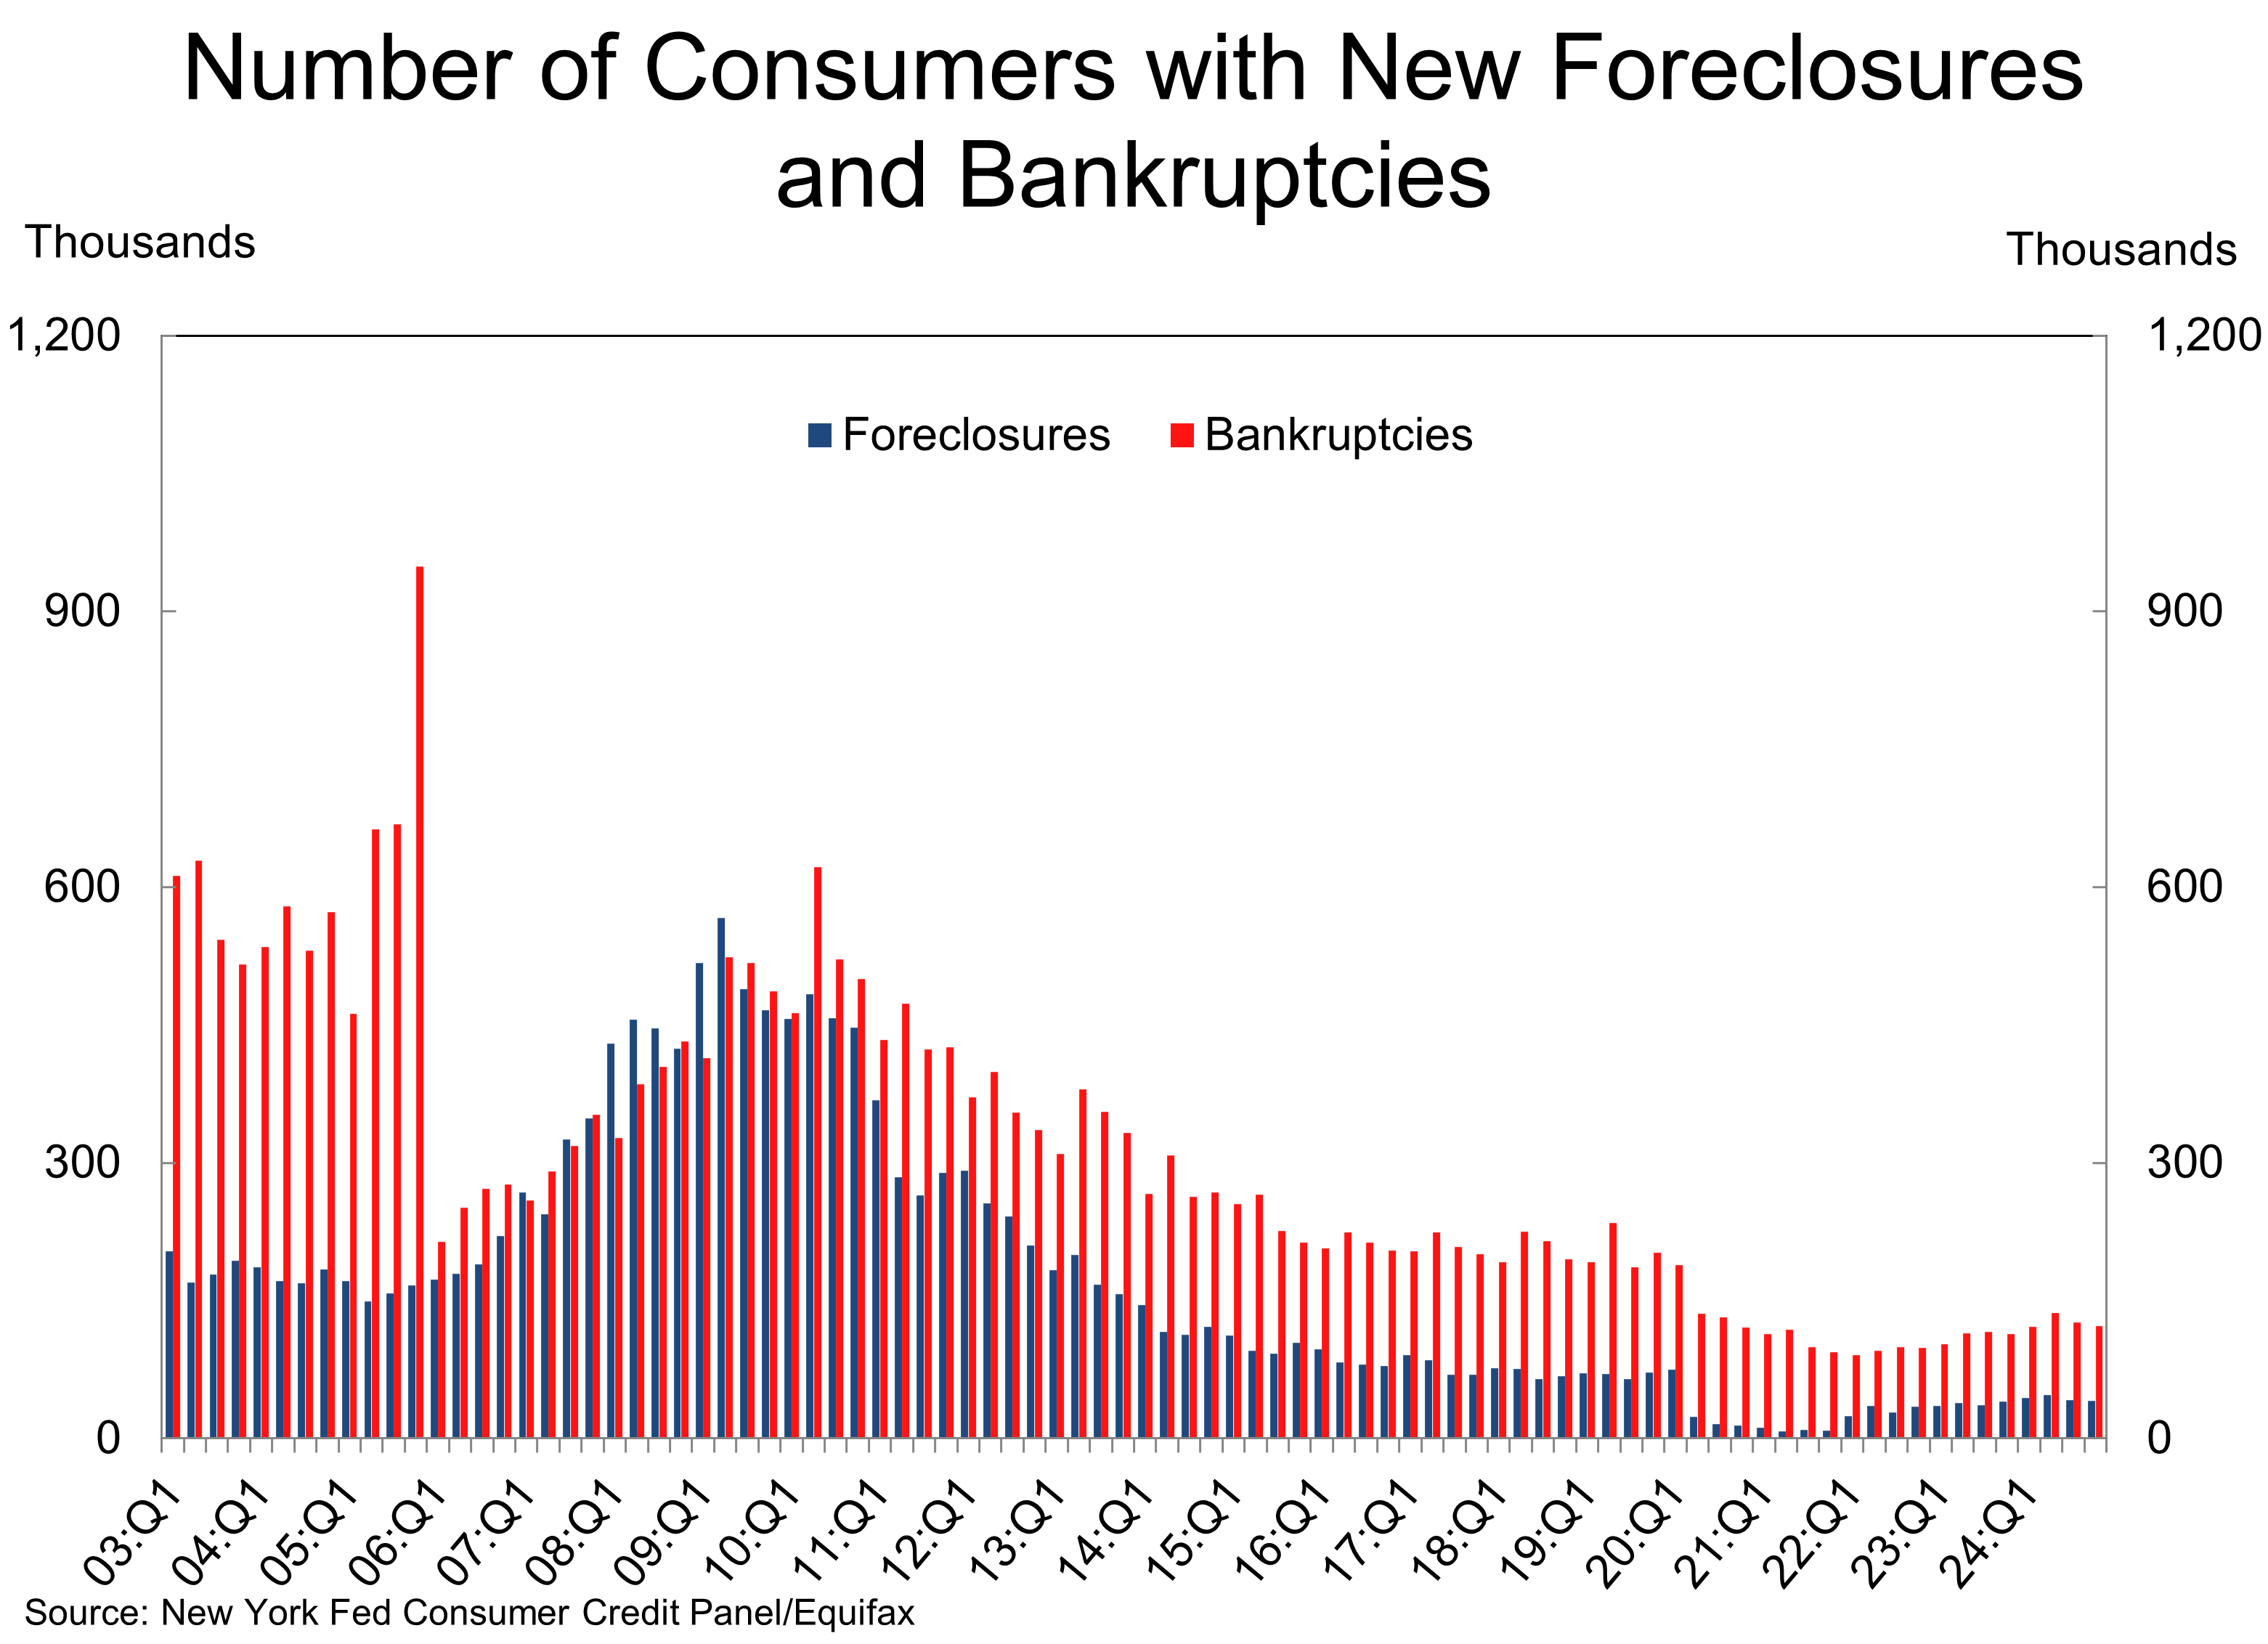
The number of consumer foreclosures fell 1% in Q4, following a big 12% drop in Q4. Foreclosures totaled 41,520 in Q4, 42% below the 2019 level of 71,420. Moreover, consumer bankruptcies fell by 3%, following a 7% decline in Q3. Bankruptcies totaled 122,660 in Q4, 39% below the 2019 level of 201,820.
Six (Bonus Reason): Household balance sheets look good across income levels
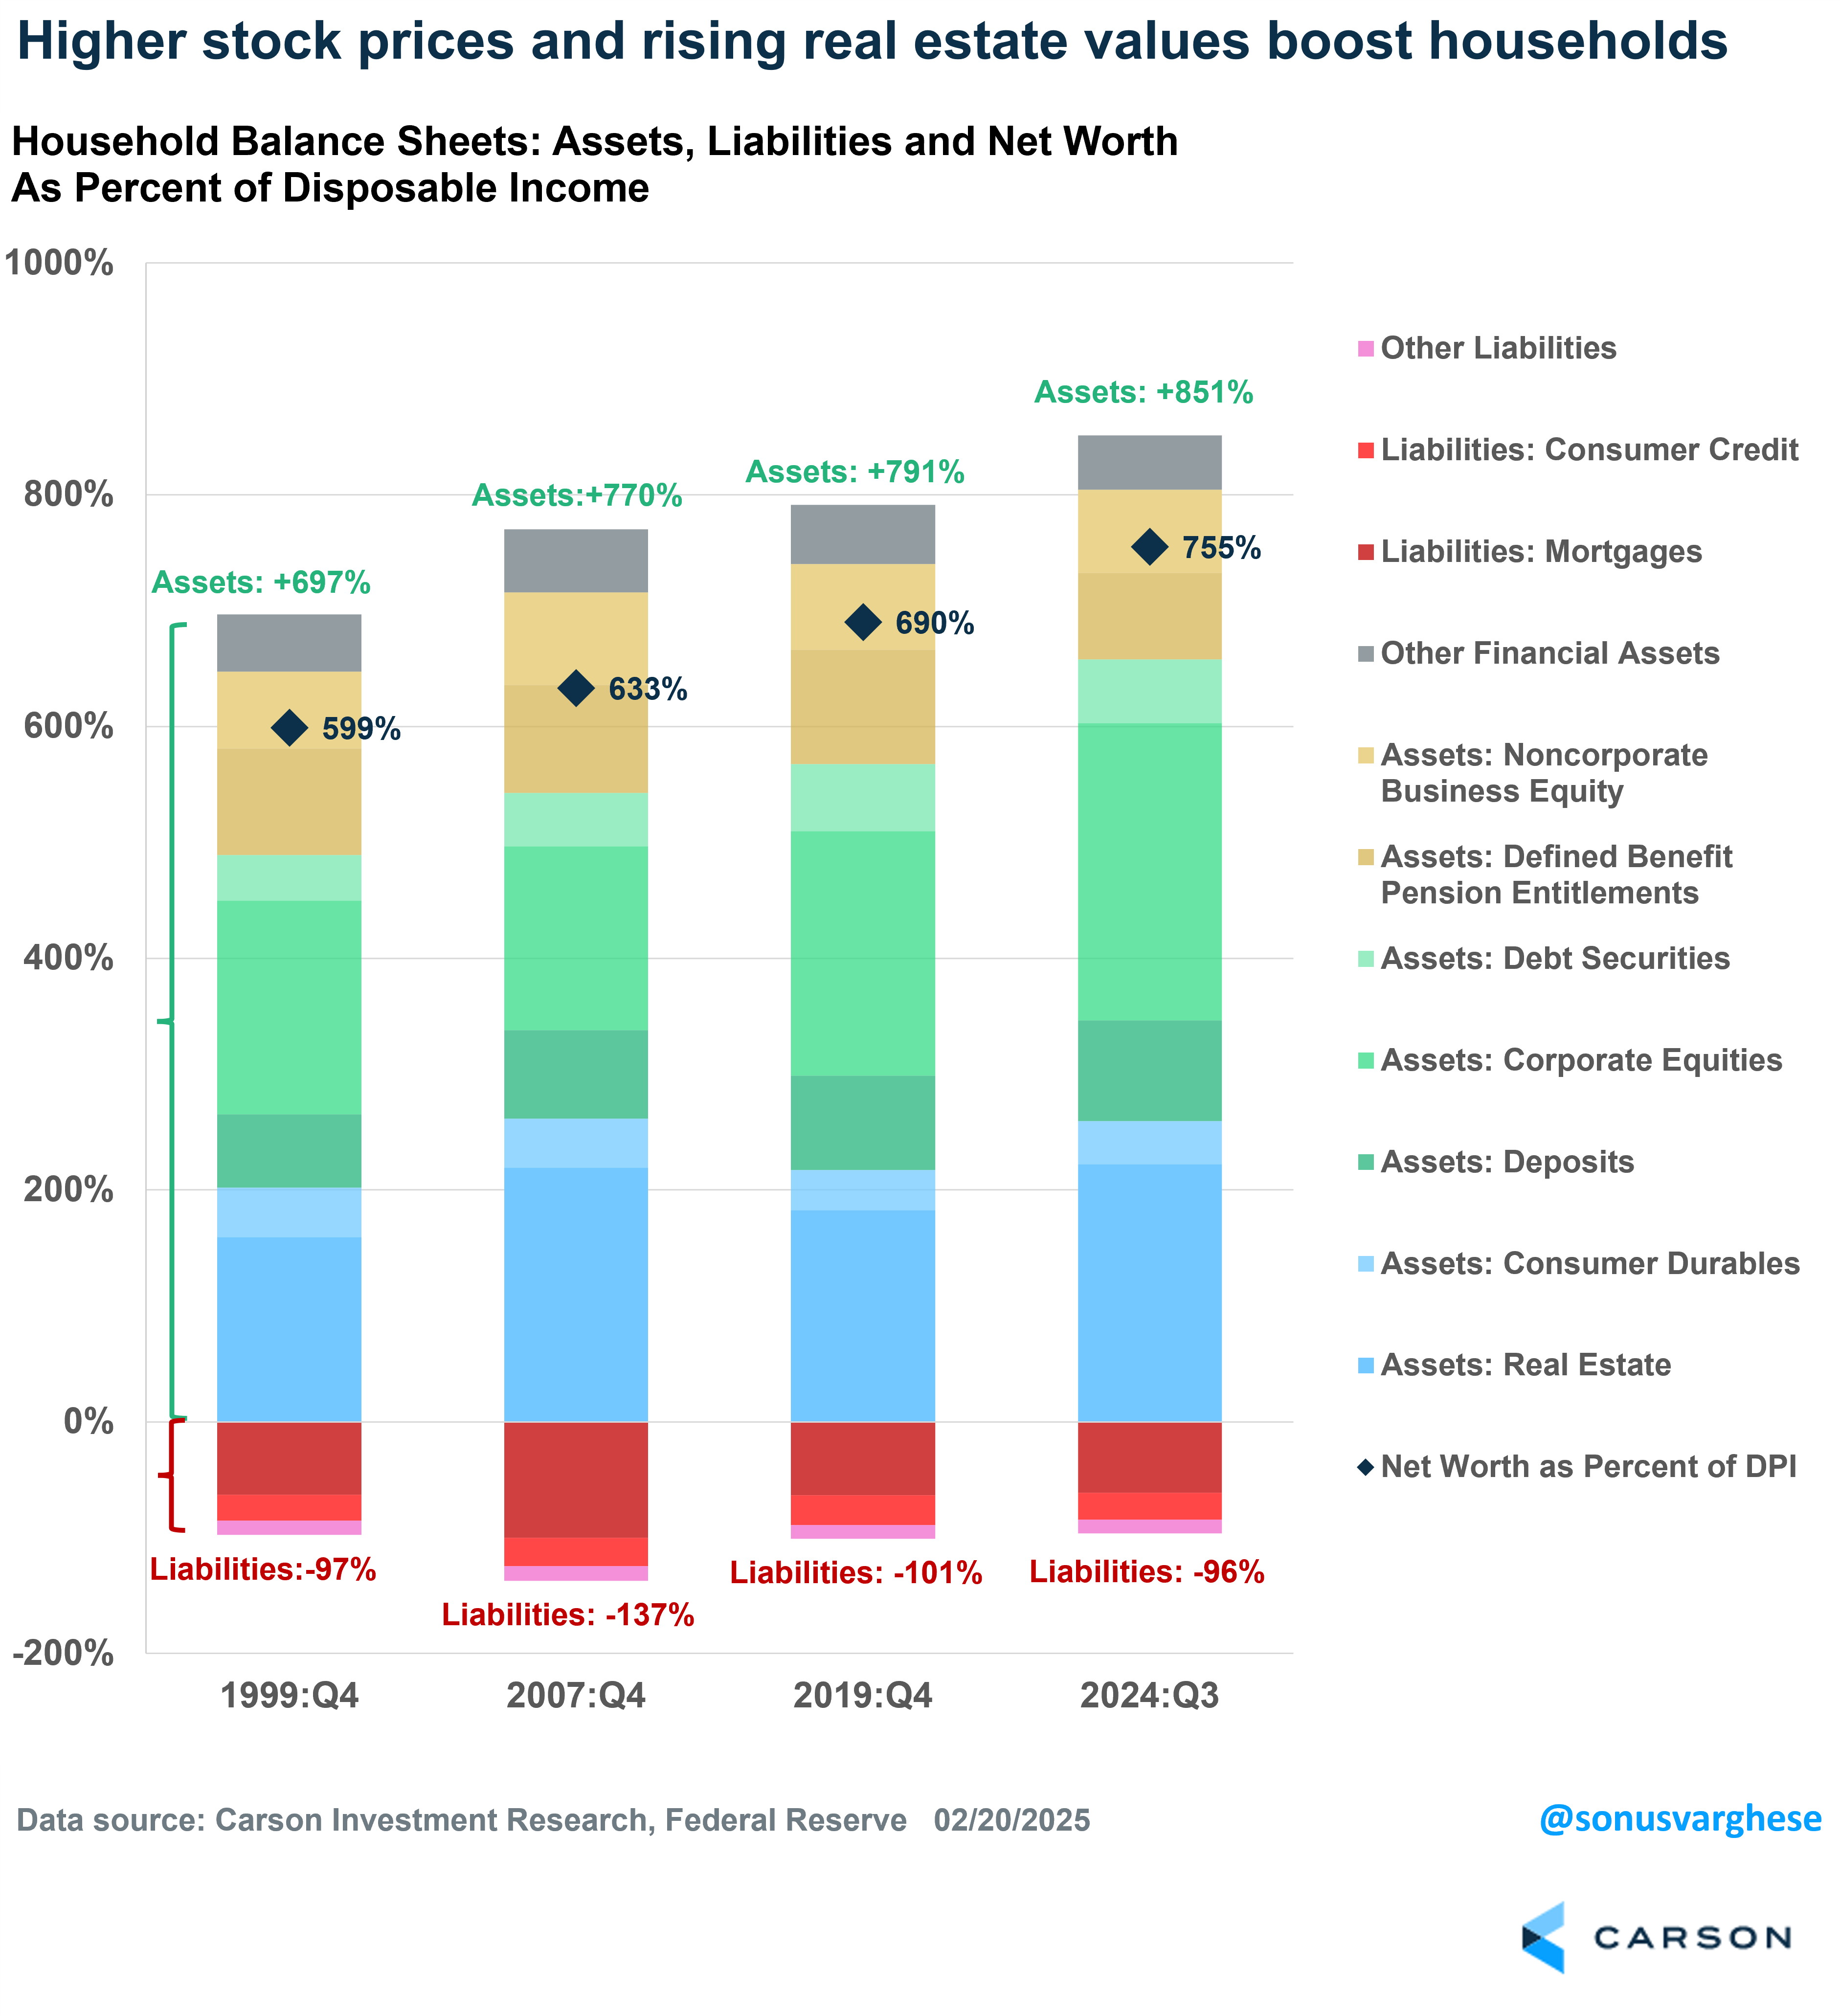
At an aggregate level, the household balance share picture looks better than ever. Assets are currently worth 851% of disposable income, up from 791% in 2019. Despite the increase in disposable income, asset values have risen on the back of surging stock prices and home values. At the same time, liabilities are running at 96% of disposable income – down from 985 a year ago, and below the 101% level in 2019. As a result, net worth is at 755% percent of disposable income, higher than at any point between 1955-2020.
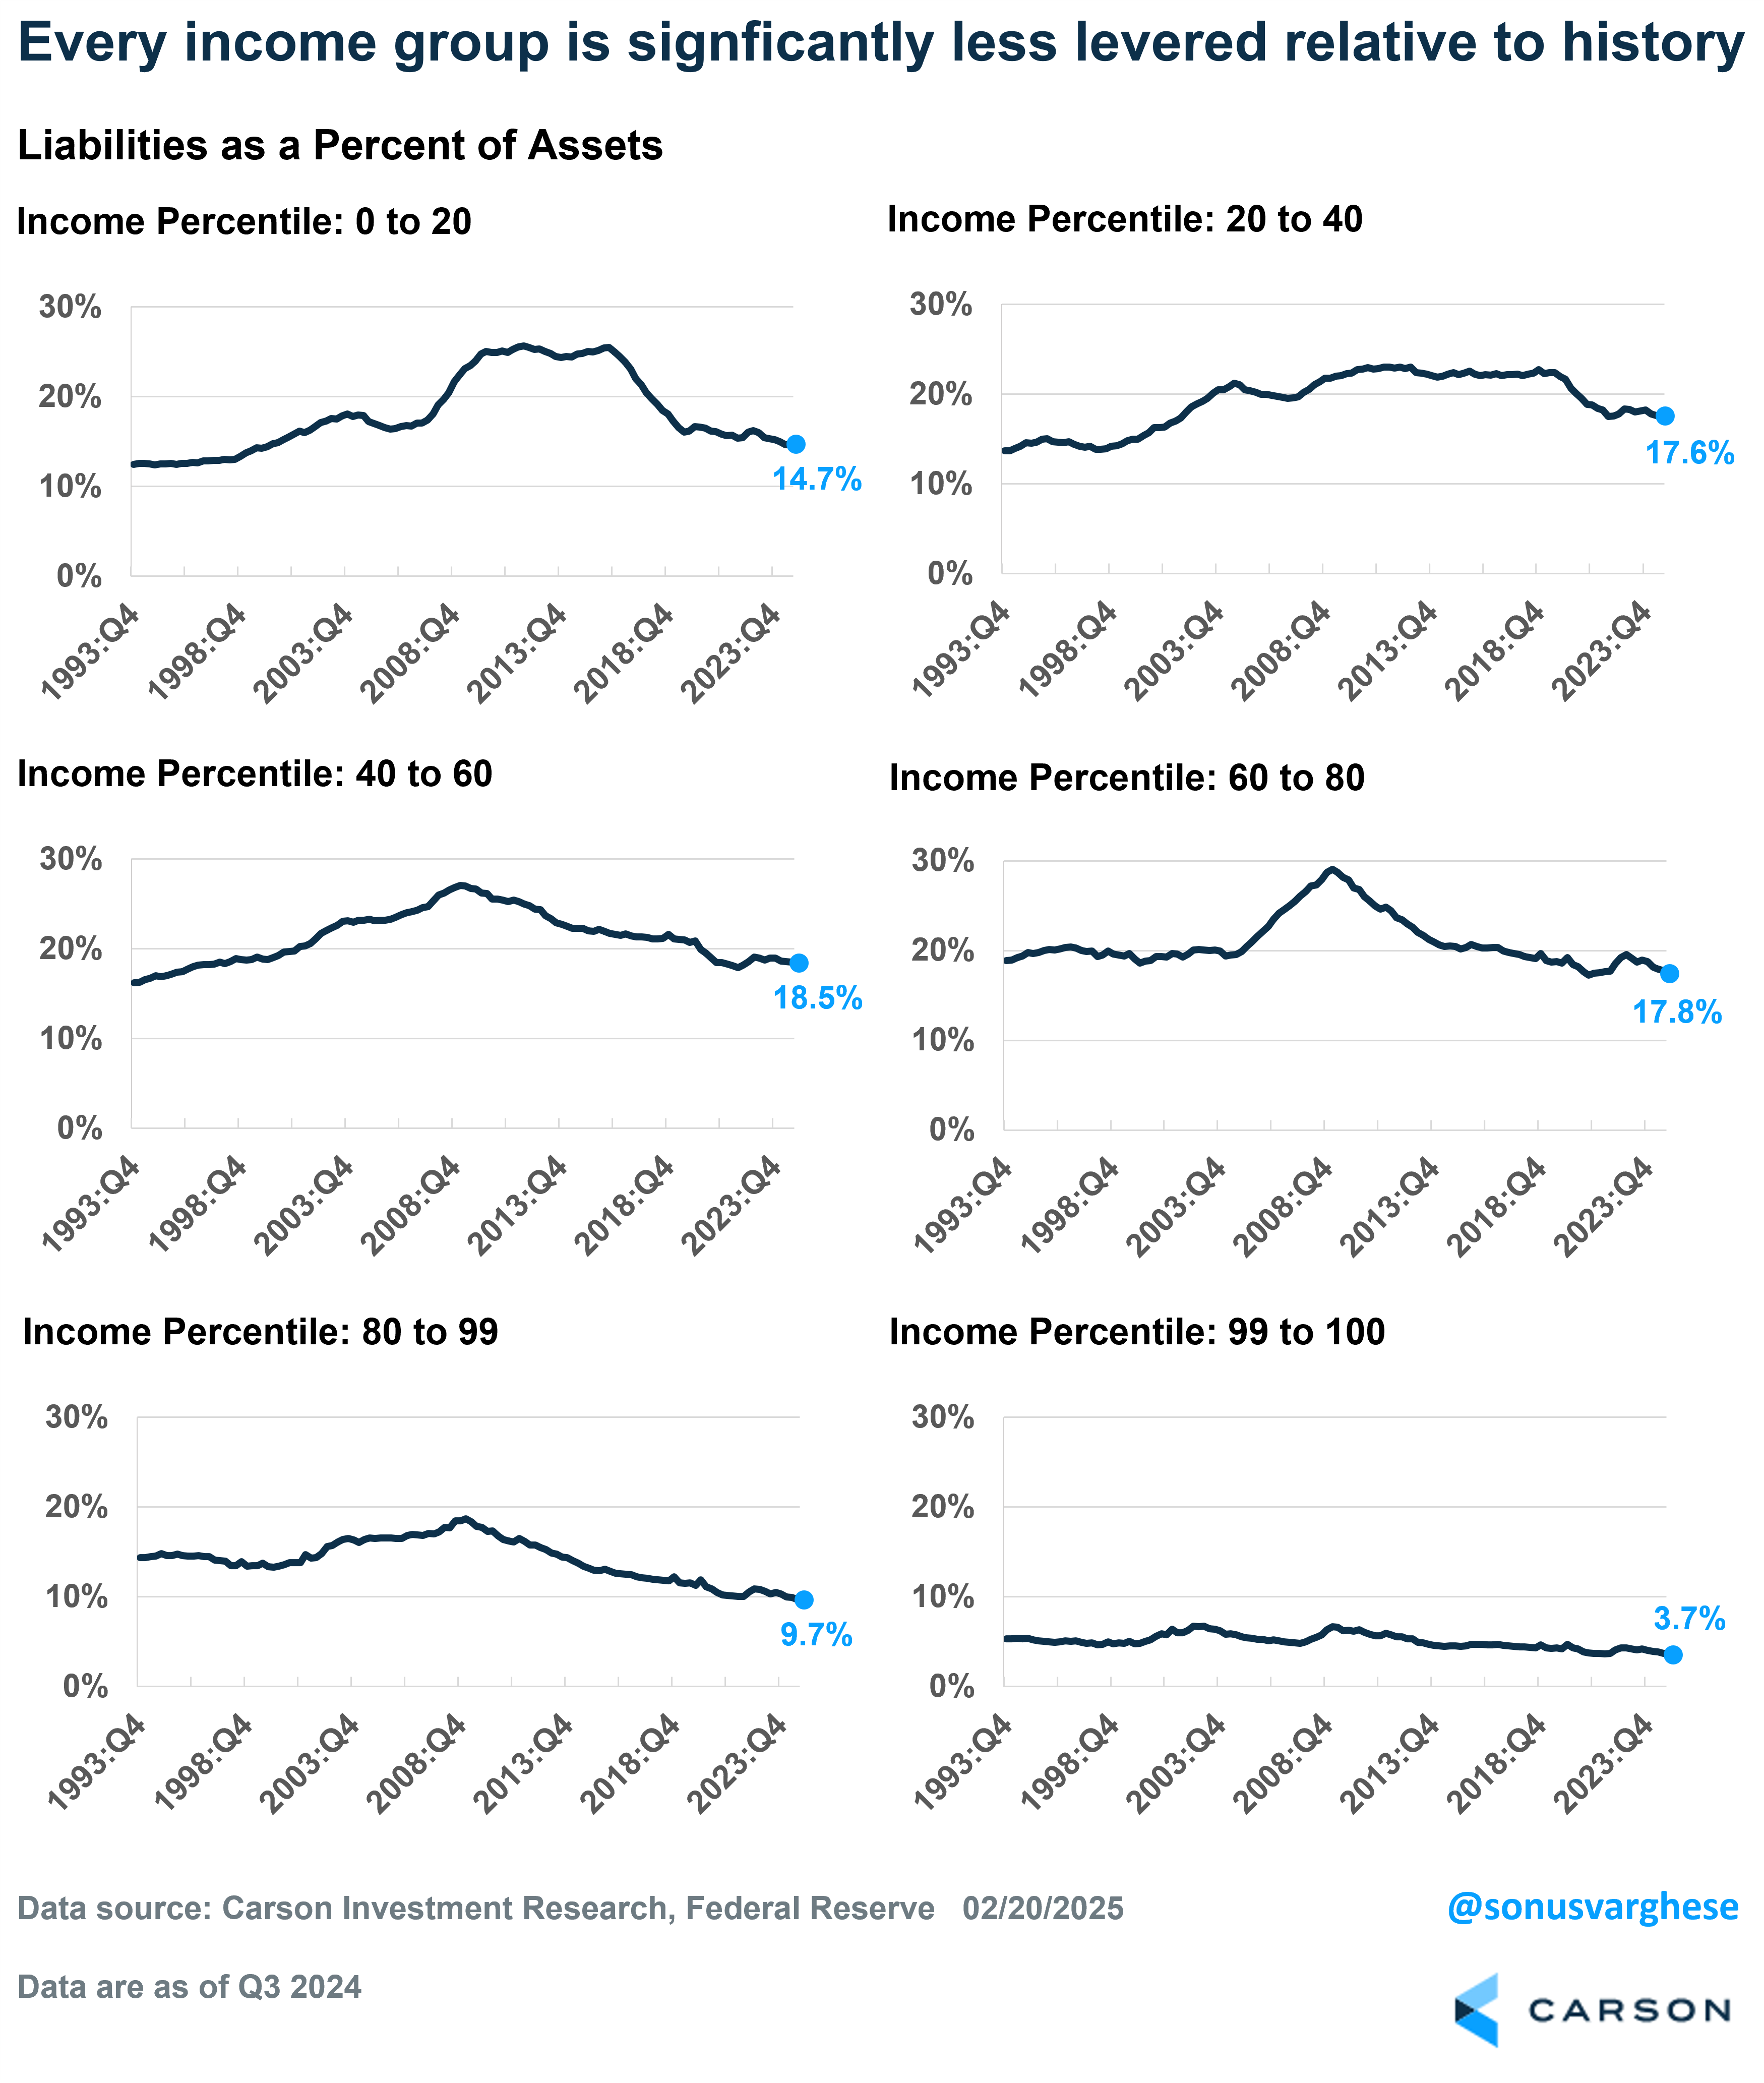
One knock against the chart above is that it’s an aggregate picture (by the way, so are the credit card debt data everyone cites). Perhaps the story is different if you look at different segments of households? Short answer is no. The picture looks good even if we look at households across the income spectrum. Here’s liabilities as a percent of assets for different income quintiles,
- 0-20th percentile: 14.7% (vs 16.2% in 2019)
- 20th – 40th: 17.6% (21.9% in 2019)
- 40th – 60th: 18.5% (20.7% in 2019)
- 60th – 80th: 17.8% (18.6% in 2019)
- 80th – 99th: 9.7% (11.3% in 2019)
- Top 1%: 3.7% (4.2% in 2019)
In short, every income group is less levered relative to where they were at the end of 2019, and as I pointed out above, 2019 was at the end of a decade of deleveraging. So things look good even relative to that high bar.
All this tells you how strong household balance sheets are, and the lack of distress relative to history (even relative to a the end of a solid deleveraging cycle like 2019). This is not to say that there are no risks out there. There certainly are, as we highlighted in our 2025 Outlook, but it’s not because households are over-levered. Carson’s Chief Market Strategist, Ryan Detrick and I discussed some of these risks on our latest Facts vs Feelings episode, including why the market has rallied to new highs even in the face of these risks. Take a listen.
For more content by Sonu Varghese, VP, Global Macro Strategist click here.
7662489-0225-A