Well, that’s a wrap on 2024. The S&P 500 finished the year with a total return of 25%, the second consecutive year over 20%, which hasn’t happened since 1998 and 1999. (Lest the bubble brigade raise an eyebrow at that last year, that was the fifth consecutive year of a total return over 20%.) There’s an old saying that markets climb a wall of worry, and that neatly captures the last two years.
To help close out our thoughts on 2024, I asked members of the Carson Investment Research team to choose their “Chart of the Year.” Collectively, they provide a nice overview of the year that was.
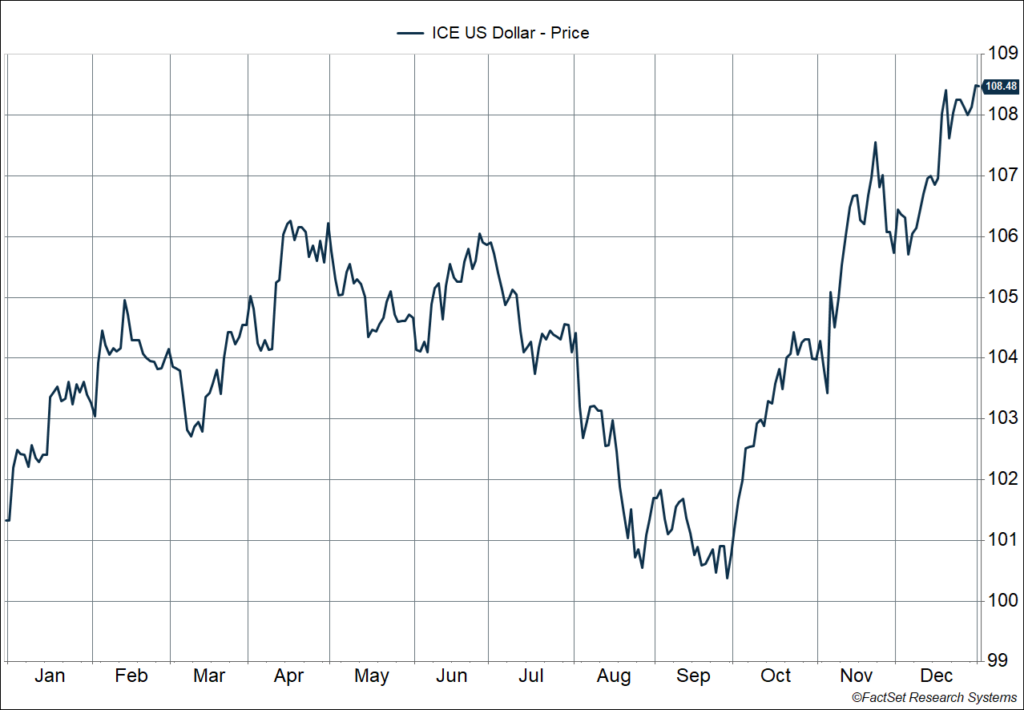
Let’s start with VP, Global Macro Strategist Sonu Varghese, who gives us King Dollar reigning once again, and dollar skeptics once again intoning the mantra they’ve clung to for decades, “We’re not wrong, we’re just early.”
From Sonu: “The US dollar index gained over 7% in 2024, a significant jump for the world’s reserve currency even as other pretender wannabe’s to the throne also shined (like gold and bitcoin – more on that below). The dollar index is now at its highest level in over two years. I chose this as my chart of the year because it captures most of the dynamics we saw in 2024, including:
- Strong US economic growth, on the back of above-trend productivity growth
- Outperformance of the US economy relative to other developed and emerging markets, as the rest of the world struggled
- A summer scare for the labor market, which increased expectations for the Fed to go for a big cut in September (which they did) and dollar weakness
- Rising interest rates in the US after September which led to dollar strength, amid strong economic data and the Fed taking recession risk off the table by committing to protect the labor market
- A relatively bigger monetary policy easing cycle in other developed economies, as central banks look to boost growth, even as the Fed may be in pause mode during the first half of 2025
- Post-election dollar strength is also a reminder that tariffs will be a focus in 2025
- Yet another year of US equity outperformance relative to international stocks, with the dollar acting as a major headwind. Japan was a prime example: the MSCI Japan index gained over 21% in local currency terms (easily besting the Dow’s 13% return, and not too far below the S&P 500’s 25% gain). However, the net USD-based return was only 8.3% thanks to the yen depreciating over 12%.”
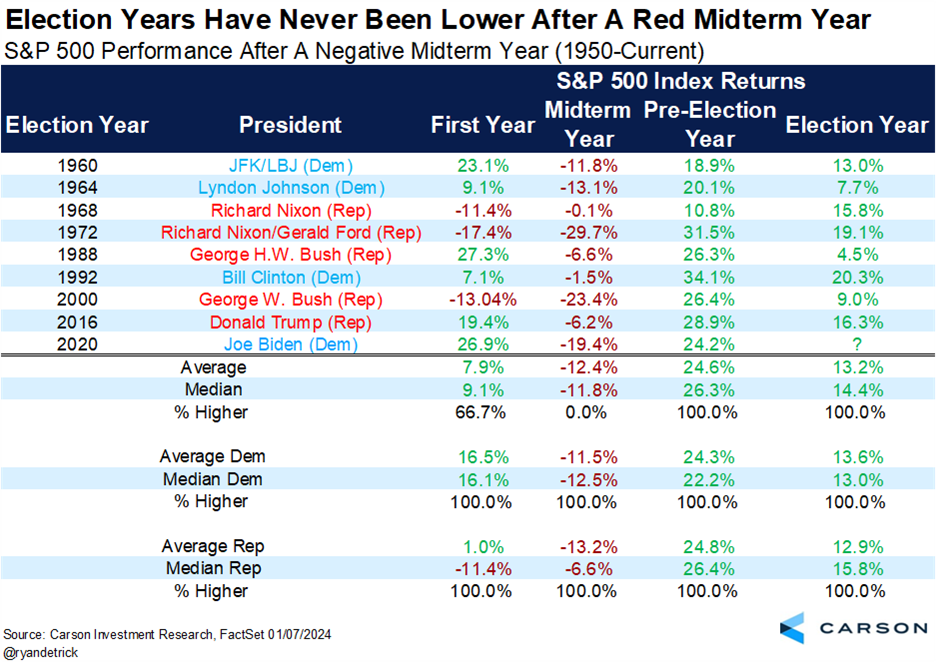
Next up is Chief Market Strategist Ryan Detrick, who reminded us that this was an election year and that there were a lot of election year cycle seasonals that held true to form in 2024. Here’s one favorite.
From Ryan: “We shared this chart early in 2024 and it suggested that election years tended to be quite strong when there was a negative midterm year, which played into the bulls favor given how bad 2022 was. Taking this a step further, pre-election years and election years have NEVER been lower after a negative midterm year, an incredible 18 for 18 now. We are still optimistic about 2025, but once we get to 2026 maybe a rough year could be necessary for more gains down the road. Let’s worry about that bridge when we come to it, but something to think about for sure!”
Next up is VP, Investment Strategist Grant Engelbart. Remember Sonu’s mention of bitcoin above? Surging prices alone may merit some consideration for chart of the year, but the bitcoin story was deeper than that.
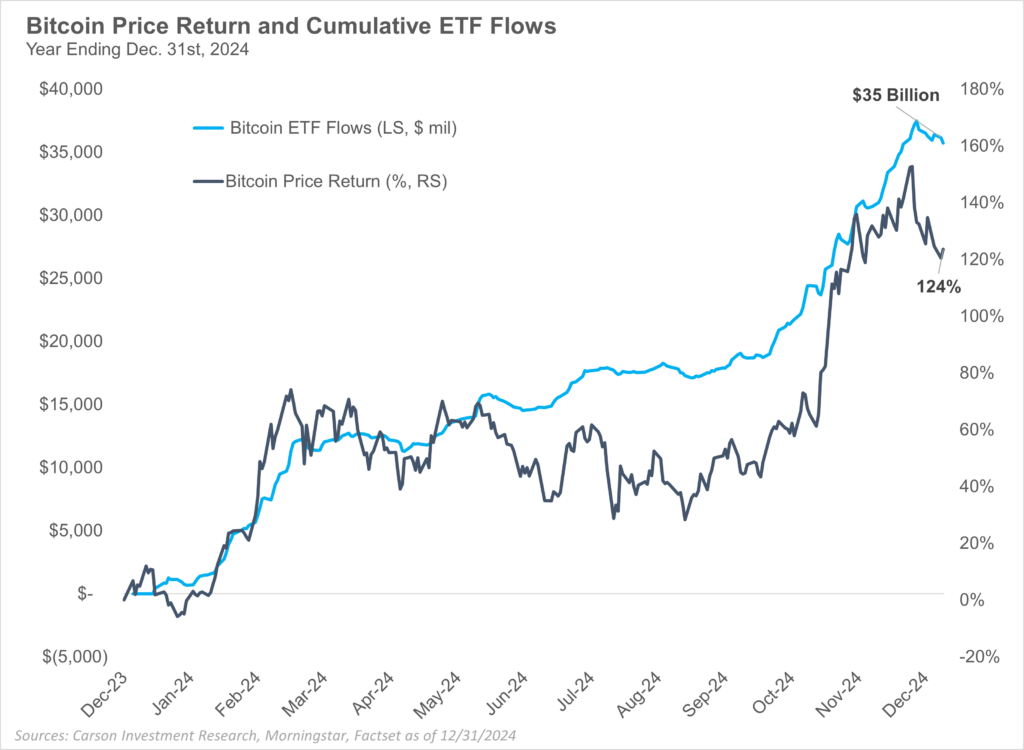
From Grant: “Traditional finance (“TradFi”) and Decentralized Finance (“DeFi”) collided in a big way in 2024. The SEC finally approved 11 spot bitcoin ETFs, and they began trading on January 11, 2024. Despite large seed assets, the first month of trading was tepid for most of the products as the price of bitcoin fell to around $40,000. As bitcoin’s price rebounded, flows surged through the spring and into the fall, only to accelerate even further following the U.S. presidential election. Net flows into various products eventually reached more than $35 billion (even as more than $21 billion left the legacy Grayscale Bitcoin Trust GBTC), with total assets reaching more than $100 billion in bitcoin ETFs. Blackrock’s product, the iShares Bitcoin ETF Trust (IBIT), was dubbed the “greatest ETF launch ever,” by Bloomberg, holding nearly half of all assets in the space. In addition to these tremendous flows (or perhaps as a result of them), bitcoin’s price exploded higher by more than 120% on the year to break new all-time highs and break through the $100,000 threshold.”
Next, we turn to our equity team for a different perspective on the year. Sure, bitcoin was up 124% in 2024, as shown in the chart above, but Nvidia did even better. As with bitcoin, that in itself is only moderately interesting. We don’t recommend chasing the hot dot as a sound approach to investing. But as Senior Investment Analyst Blake Anderson points out, there’s more to the Nvidia story than just price appreciation.
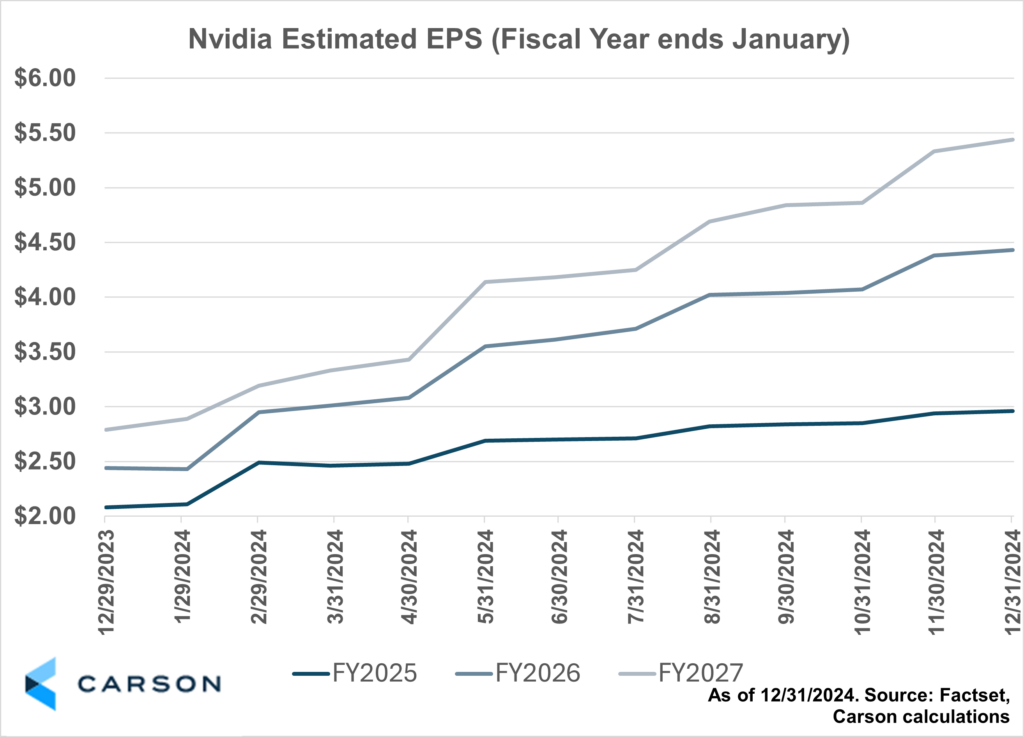
From Blake: “My Chart of the Year is Nvidia’s FactSet Consensus EPS estimates. Nvidia entered 2024 having seen a +239% stock price gain in 2023 and many believing ‘it was fully priced.’ The stock proceeded to gain +208% for the year at its 2024 highs, largely driven by increasing EPS estimates. Sell-side analysts now believe Nvidia will report earnings per share (“EPS”) of $2.96 in fiscal year 2025 (which ends in January, so nearly calendar year 2024) versus their initial estimate of $2.08 entering the year. That represents a positive EPS revision of +42%. What’s more, analysts have even higher conviction about Nvidia’s future, with 2027 EPS seeing a positive revision of +95% throughout the year! It’s a reminder that ‘good’ can always get ‘better.’”
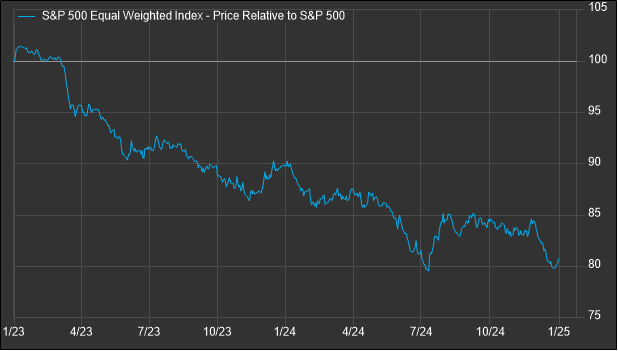
A challenge for portfolio managers over the last two years has been the dominance of a relatively small number of technology-oriented US megacap stocks. In fact, in 2023 and 2024 the S&P 500 Index bested the S&P 500 Equal Index by more than 10 percentage points two years in a row for the first time in its history (although the history only goes back to 1990). That gives Portfolio Manager Mike Lawrence his chart of the year, accompanied by an important note of caution.
From Mike: “Market index concentration continued nearly unabated in 2024 as the Magnificent Seven group of stocks again posted stellar returns. The S&P 500 Index outperformed the S&P 500 Equal Weighted Index by a wide margin in 2023 and once again in 2024. In this environment, passive investors have become increasingly exposed to a small number of stocks. While current market concentration seems to have fundamental backing, high concentration levels, like those seen during the nifty-fifty and dot-com eras, have tended to eventually reverse.”
Source: FactSet 12/31/2024
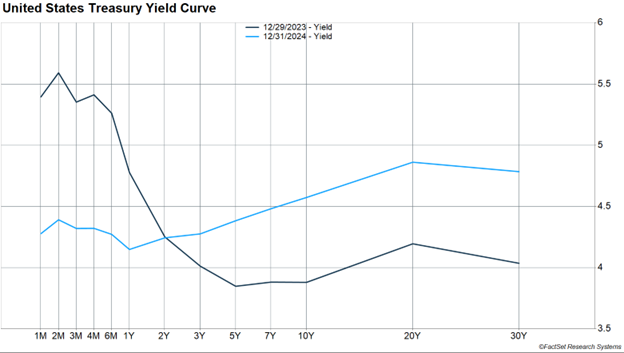
Finally, my candidate for Chart of the Year is a comparison of the yield curve at the end of 2023 and 2024. As you can see below, over the course of the year, we went from a largely inverted yield curve at the end of 2023 (short-term rates higher than long-term rates) to a normally sloped curve at the end of 2024. Another way of saying that is that short-term rates have fallen well below where they were at the end of last year and long-term rates have risen. The pivot point is the two-year yield, which hardly moved.
That change tells a lot of the economic story for the year. Short-term yields fell on Fed rate cuts, although fewer than expected at the start of the year as the economy topped expectations. Long-term yields rose from a combination of improved growth expectations, some movement in inflation expectations, and a rise in the additional premium demanded from investors for greater uncertainty at the longer end of the curve. The 10-year yield rose 0.69%-points, but it’s hard to model out the contribution from the three sources and quite a bit of active debate around the main driver.
On a forward-looking basis, the change in the curve tells us that 10-year Treasuries are starting with a 1.78%-point head start versus 3-month Treasuries to open 2025 compared to 2024 (a three-month yield that is 1.09%-points lower and a 10-year yield that is 0.69%-points higher than the start of 2024). I know 10-year yields have been climbing with some momentum, but that’s a nice head start for intermediate Treasuries versus the start of last year. Also keep in mind that when the 10-year Treasury yield peaked in October 2023, the fed funds rate was a full percentage point higher and trailing year core CPI inflation was still over 4%.
There you have it, a snapshot of 2024 from the perspective of some of the most interesting charts over the year. But 2024 is so last year. Our focus now is on what the candidates for Chart of the Year might be at the end of 2025. We are in the countdown to the release of our Outlook 2025, coming out in less than two weeks now, and are excited to soon be sharing a comprehensive look at our current thoughts on the year ahead.

Stay on Top of Market Trends
The Carson Investment Research newsletter offers up-to-date market news, analysis and insights. Subscribe today!
"*" indicates required fields
For more content by Barry Gilbert, VP, Asset Allocation Strategist click here.
02577039-0125-A


