We talked a lot about how February (especially the second half of February) could be a potential break for stocks, well the good news is that we now see many signs of better times potentially coming soon.
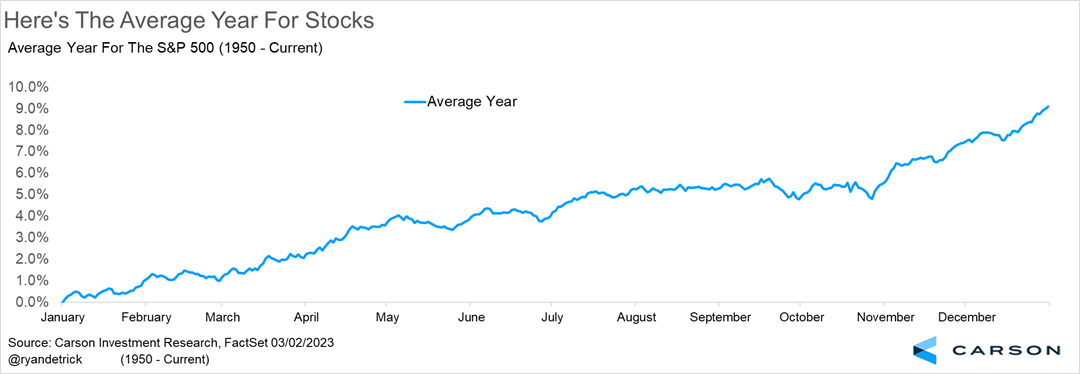
Here’s what the average year for the S&P 500 looks like. Looking at the chart below, the blue line shows gains from January through April, and November and December are normal. It is the middle part of the year that stocks tend to struggle.
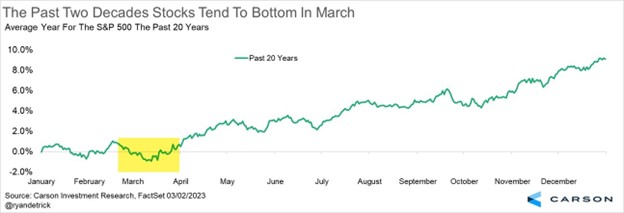
Lately, things look a little different. Looking at only the past 20 years showed that stocks tended to bottom in March. This is likely due to major bear market lows taking place during this month in 2003, 2009, and 2020.
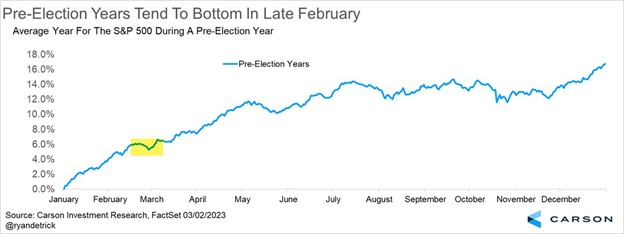
We’ve shared before that pre-election years tend to be strong for stocks, lower only twice going back to World War II and up nearly 17% on average, making this historically the strongest year of the 4-year Presidential cycle. Looking at these years it is once again common to see the second half of February weakness and a tradeable low in late February.
Building on this, we found that pre-election years of a new President do even better, up close to 20% on average. But wouldn’t you know it, right about now tended to be a consolidation period before late March and April strength.
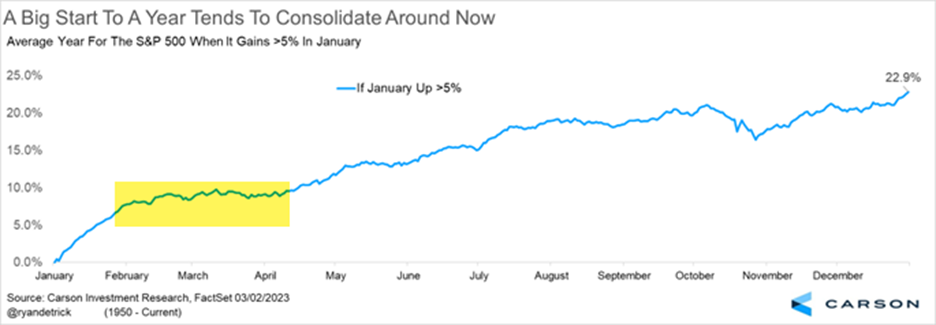
What about years that started off with big gains? When stocks gained more than 5% in January (like 2023) we found that a consolidation period took place now and into April. The good news is that eventual gains of close to 23% on average were how things ended up, suggesting any potential consolidation here could potentially be used as an opportunity.
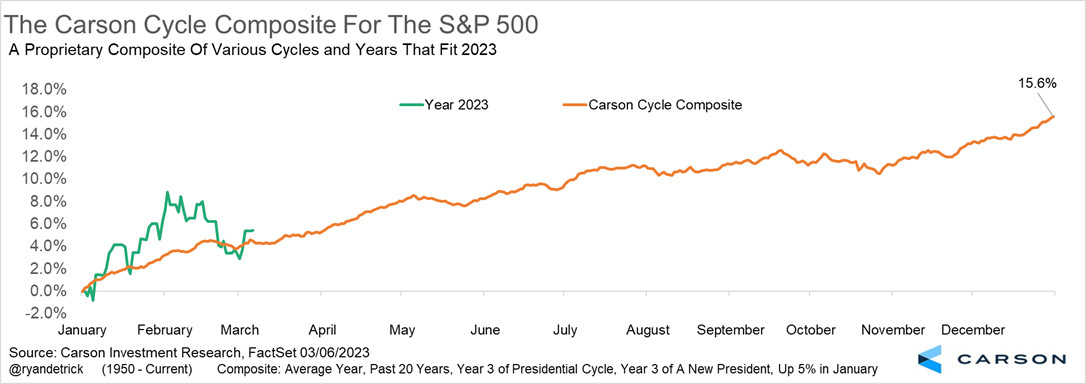
Lastly, I’ve seen other places combine many of the things I’ve just discussed and make one composite combining them all. I did that and we called it the Carson Cycle Composite. This proprietary composite looks at the average year, pre-election years, pre-election years under a new President, the past 20 years, and years that had a 5% January. As you can see, this year started off stronger, but as of early March is right in line with what the average composite looks like. Take note, a gain of 15.6% is what has been the average Carson Cycle Composite.
The bottom line is many cycles suggest the potential for some type of a consolidation here and now would be perfectly normal, but the likelihood of strength before the end of the year is quite strong.
For more of our thoughts on today’s markets and economy, listen to the 24th episode of Carson’s Facts vs. Feelings podcast below. Sonu and I had a lot of fun recording this one and we covered much ground.


