A political strategist once said that if there were reincarnation, he would want to come back as the bond market. “You can intimidate everybody,” as he put it. With good reason, investors watch bond markets carefully for all sorts of signals about the economy, monetary policy, and inflation.
And right now, a key signal from the bond market – the yield curve – is flashing bright red, warning about impending recession. The yield curve is simply a curve showing interest rates on US treasury bonds across various maturities. Yields on the short end of the curve, i.e., smaller maturities, typically rise and fall depending on what investors expect the Federal Reserve (Fed) to do over the next year or two. Interest rates on the long end of the curve, with maturities of 5 years or more, are typically higher than those on the short end. If investors anticipate higher growth and inflation, they will demand much higher interest rates, widening the “spread” of difference between short and long-term yields.
In extreme cases, we get inverted yield curves, with short-term rates higher than long-term rates. This normally does not make intuitive sense since it implies that long-term investors, who face more uncertainty and risk, are settling for less compensation than short-term investors. It typically happens when the Fed raises interest rates to prevent overheating of an economy (like they have this year), while bond market investors kind of take the opposing view – believing that the Fed will go too far and push the economy into recession, which would be accompanied by much lower inflation and hence, lower long-term yields.
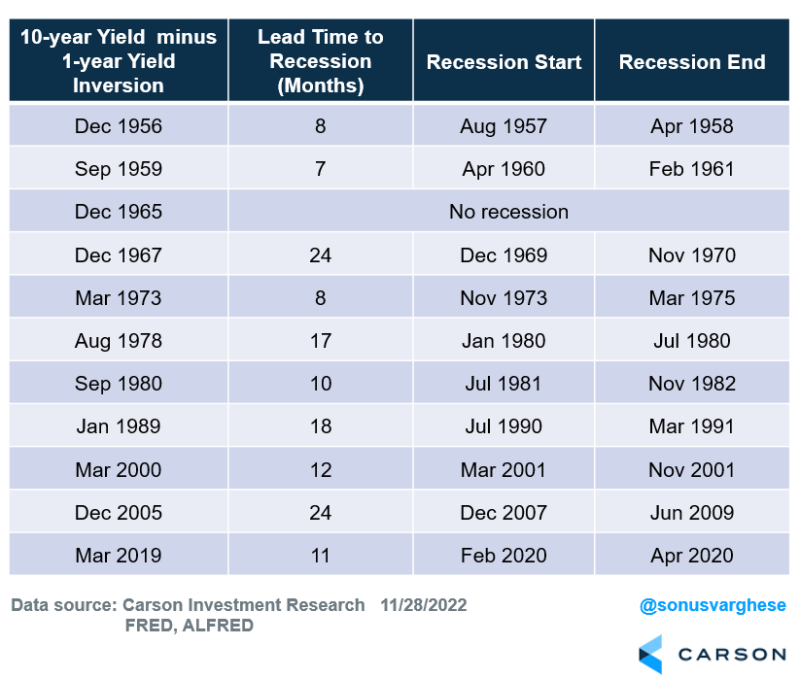
The yield curve inverted prior to the last ten recessions, with just one false signal in 1965. The table below shows yield curve inversions (as defined by the 10-year/1-year spread turning negative), along with the timing of the recession that followed. No surprise that this is a favored recession indicator.
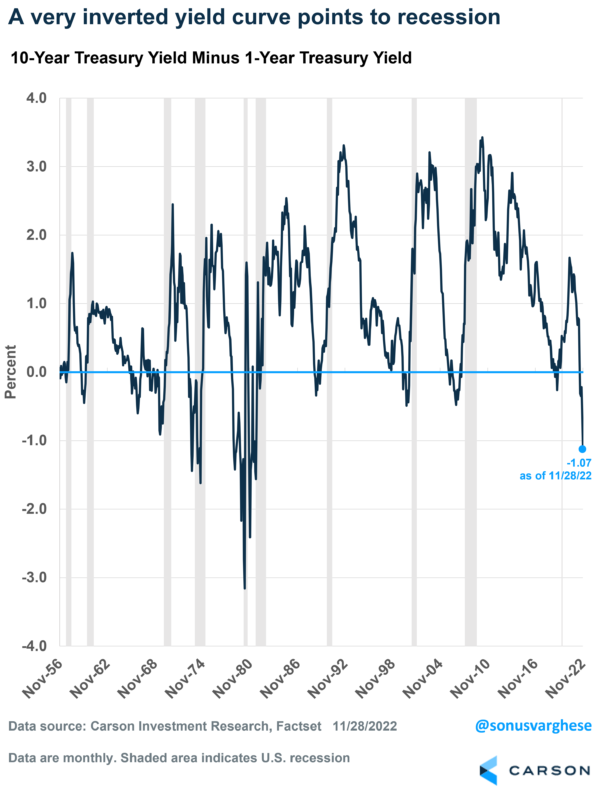
The chart below shows how the 10-year/1-year spread has gone negative prior to the shaded bars, i.e., recessions. The bad news is that this spread inverted back in July of this year and is currently at its most negative, or “inverted state,” since 1982. Indicating a recession is on the horizon if you consider the historical precedent.
What does it really tell us, beyond “Yes, Recession”
One thing you notice from the table and chart above is that while a recession has followed inversion, the degree of inversion doesn’t say anything about the following:
- When a recession will start – the start time has varied from 7 to 24 months
- How long the recession will last – we had prolonged recessions in 1974 and 2008, and the degree of inversion was quite different prior to these
- How deep the recession will be – the degree of inversion was similar prior to the 2001 and 2008 recessions, but these were very different economic drawdowns
Another huge caveat I would add to the track record: the inversion in 2019 technically preceded the 2020 recession, but it didn’t really “predict” it in that it didn’t predict Covid-19.
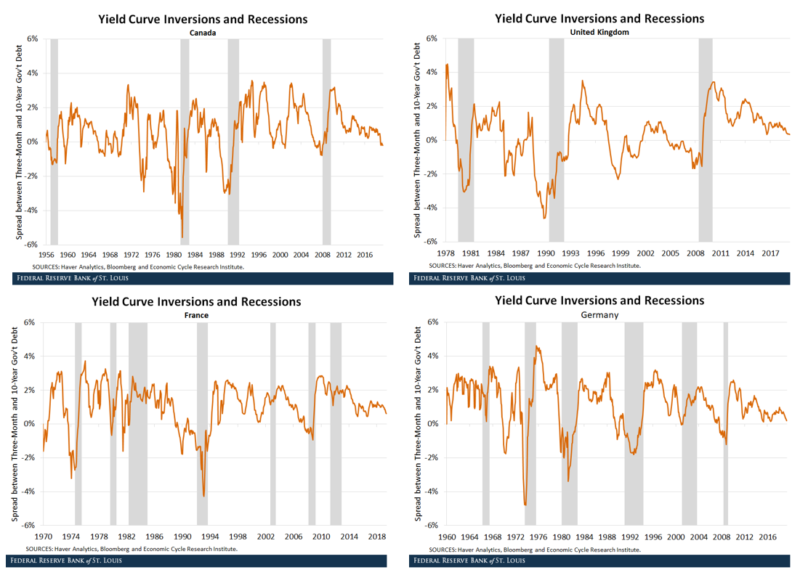
Also, the yield curve has a bit of a dubious record outside the US, as this study from the St. Louis Federal Reserve points out. Several yield curve inversions occurred in the U.K. and Canada that did not predate recessions, i.e., you had a lot of false signals. But it worked better in the US, France, and Germany.
A symptom rather than a cause
Yield curve inversion is more of a symptom rather than a cause. The logic is that the Fed tightening too far leads to an expectation of slower economic growth (or recession), which leads to lower inflation expectations (there’s less demand for goods and services). Which in turn results in long-term yields falling below short-term yields. To a first approximation, long-term yields are simply the expected path of future short-term rates, i.e., monetary policy. And so, if inflation is expected to be lower in the future, especially amidst a recession, you would expect the Fed to reduce rates.
Note that higher rates can take their toll on the economy. For example, housing activity can decline amid higher mortgage rates, and businesses may cut back on spending/hiring if they find borrowing terms to be much higher. But these usually occur only with a lag – which is why a recession doesn’t follow immediately after the Fed raises rates and yield curves invert.
Look toward inflation expectations
With respect to yield curve inversions, a lot of it comes down to inflation expectations. Inflation expectations can fall if investors expect a recession.
But, longer-term inflation expectations can also be lower than short-term inflation expectations if inflation has surged recently and investors believe it to be a short-term phenomenon. Sound familiar?
It’s not easy to directly gauge inflation expectations, but we can calculate them using securities called inflation swaps. Without getting into too much detail, these are used to transfer inflation risk from one entity to another. You have swaps ranging over various periods, e.g., 1, 2, 3, 5, and 10 years, which can tell you what investors expect inflation to average over these periods.
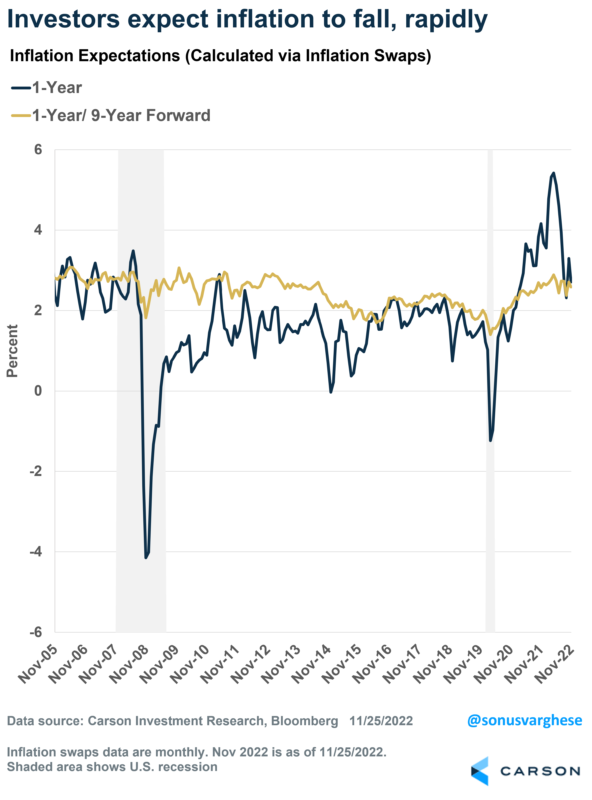
The chart below shows 1-year inflation expectations versus 1-year/9-year forward inflation expectations. The latter is the inflation expectation over the 9-year period that begins one year from now – my goal is to separate short-term inflation expectations from longer-term expectations. As you can see, 1-year inflation expectations surged above longer-term expectations over the past 18-20 months. Prior to 2021, the 1-year/9-year forward expectation was mostly above the 1-year. But they’re converging again, with investors expecting inflation to average about 2.7% over the next year. At the same time, the 1-year/9-year forward expectation is just under 2.6%.
What also comes out of the graph is that during the 2008 and 2020 recessions, 1-year inflation expectations collapsed well below the longer-term series. Based on that, it doesn’t look like markets are expecting a recession now.
- 1-year inflation expectations are still slightly above the 1-year/9-year forward inflation expectation
- 1-year/9-year expectations have barely fallen, in contrast to what we saw in 2008 and 2020 when they were below 2%
Could we be headed for stagflation, i.e., a recession with high inflation? Well, the 1-year/9-year forward expectation is around 2.6% right now – it doesn’t exactly scream stagflation, let alone high inflation.
To wrap up, the yield curve may be as inverted as it is today because the Fed is hiking short-term rates even as long-term yields fall on the back of lower inflation expectations – in a sense vindicating the rate hikes. However, there are other factors, including a reversal of supply-chain-related issues that pushed inflation higher in the first place. My colleague, Ryan Detrick, and I have written quite a lot about why we think inflation is off the boil (see here and here).
And just as important, inflation expectations beyond a year are not pointing toward a deflationary recession or stagflation, for that matter.
Of course, investors could be wrong, and things could change in a hurry. This is something I’ll be watching closely.


