“August slipped away into a moment in time, ’cause it was never mine.” — Taylor Swift
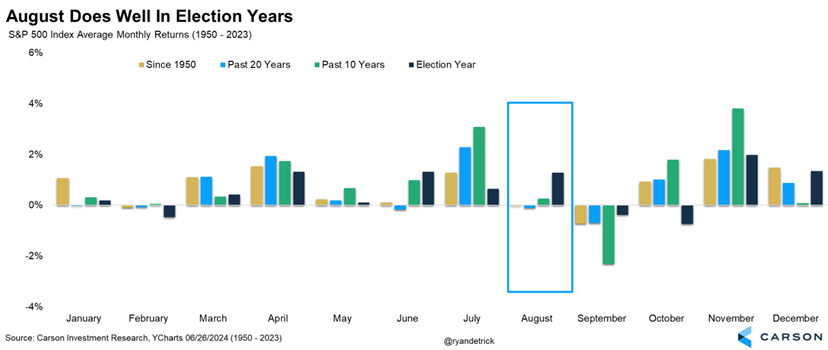
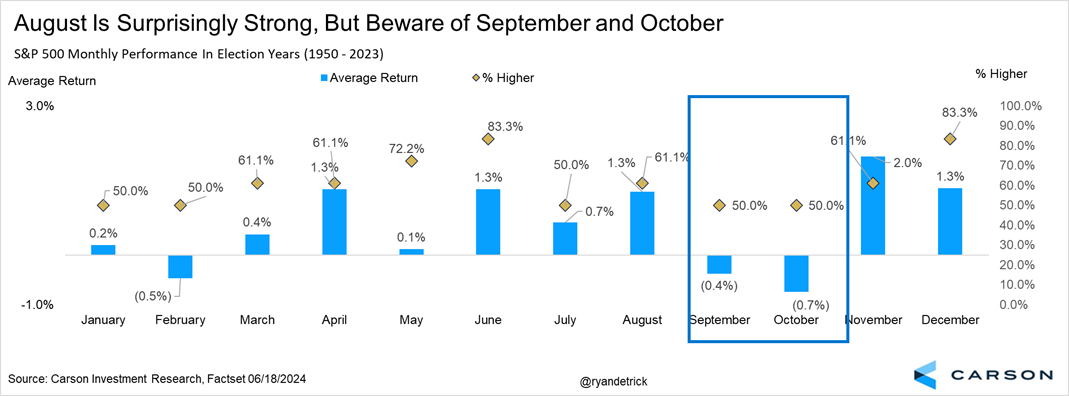
Let’s get right to the point, August historically isn’t a very good month for stocks. Most people know this and it is factually true, as stocks are down on average during this month since 1950 and the past 10 years, something only February and September can also say. But here’s the catch, and there’s always a catch, stocks have historically done quite well in election years in August.
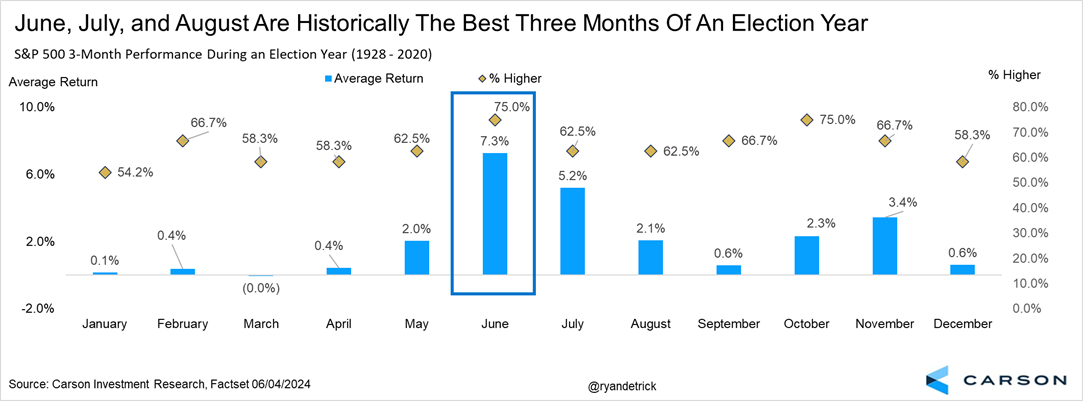
Here’s a chart we’ve shared a lot lately and it was one reason we expected a surprise summer rally when so many were telling us about yield curves and LEIs as reasons to be bearish. The bottom line is June, July, and August are historically the best three months for investors in an election year and this year has again rewarded them so far.
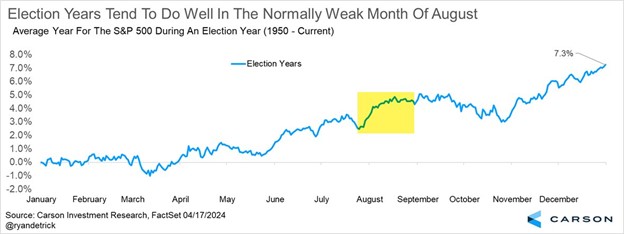
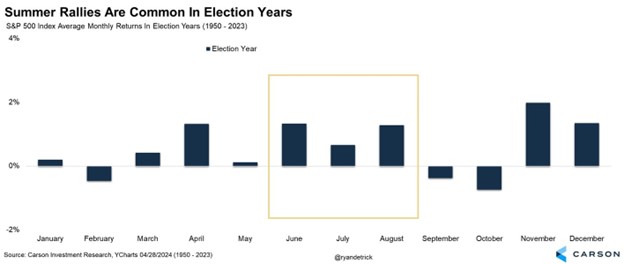
Here are two charts that show other angles on how stocks historically do well August, again showing if you are looking for a big drop this month, it might not happen.
Let’s be realistic though, this is an election year and you tend to get volatility as the election nears. Think about 2016 and 2020, as both years saw some heavy volatility and weakness ahead of those elections and we don’t think this year will be all that different. September and October tend to be weak, before the usual post-election bounce. Be sure to read Seven More Reasons This Bull Market Has Plenty of Life Left for more on why we remain firmly in the camp that any weakness should be used as an opportunity.
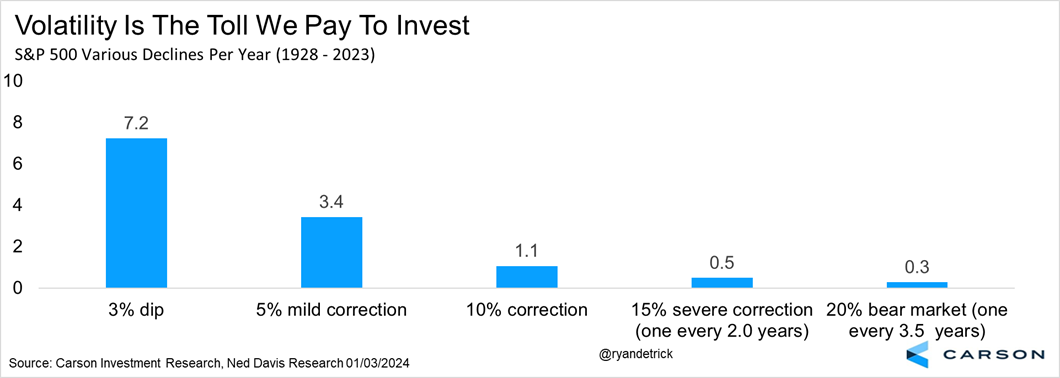
Lastly, we like to say around here that volatility is the price we pay to invest. This chart is one of our favorites and it shows that most years (even the best) tend to have multiple scary moments over the course of the year. Last year is a perfect example, as stocks gained close to 25%, yet had a standard 10% correction into late October that had many investors quite worried and selling. Given all we’ve seen so far this year was one 5% mild correction, we do think the odds at some point before the election are strong that we could see a pullback between 6-8%.
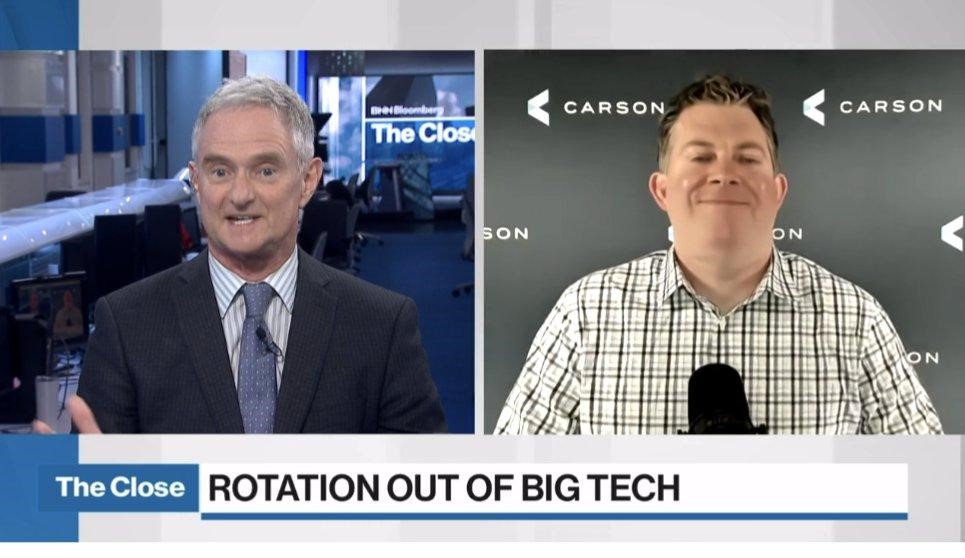
I joined BNN Bloomberg recently to discuss many of these concepts and you watch that full interview here.

Stay on Top of Market Trends
The Carson Investment Research newsletter offers up-to-date market news, analysis and insights. Subscribe today!
"*" indicates required fields
For more content by Ryan Detrick, Chief Market Strategist click here.
02341893-0724-A


