In yesterday’s blog, our chief market strategist Ryan Detrick took a look at “Sell in May and go away” and provided a lot of important insight on what it may mean in current market context. While we’re entering a period of historical seasonal weakness, the seasonals alone aren’t strong enough to drive a change in our allocation views, and surrounding factors, including an election, even suggest more equity upside.
While not headline grabbing, we thought we would complement that piece by taking a similar look at fixed income. To get a cleaner picture of fixed income, we focused on US Treasuries (the Bloomberg US Intermediate Treasuries Index) rather than the broad US Aggregate, which has some credit risk.

Stay on Top of Market Trends
The Carson Investment Research newsletter offers up-to-date market news, analysis and insights. Subscribe today!
"*" indicates required fields
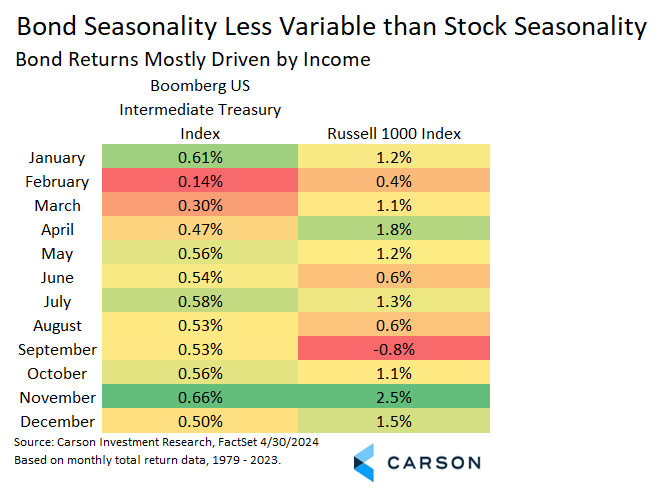
The most important thing to know is that bonds just finished their worst seasonal three-month period. In fact, not only is it the worst three-month period, but February, March, and April individually are historically the three worst months of the year. And while the data below doesn’t include 2024, that pattern is certainly holding true this year.
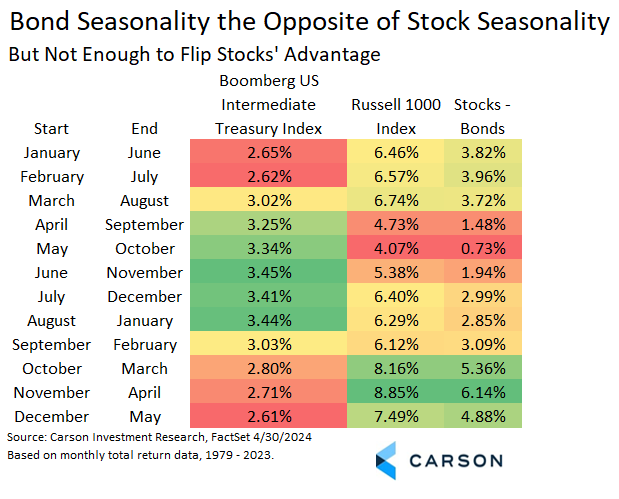
Paralleling Ryan’s study and looking at six-month periods, May starts one of the best periods, lagging only a little bit behind June through November. It’s not surprising to see bonds perform above average when stocks perform below average and vice versa. Despite our experience over the last few years, bonds on average, and Treasuries in particular, tend to be equity diversifiers.
But keep in mind, even if you match the best six-month period for stocks with the worst six-month period for bonds, stocks still outperform, although the edge historically is smallest starting in May. But given we expect there’s quite a bit of noise in these numbers the actual expectation would be wider. Throw in Ryan’s comments on current stock expectations due to the strong start to the year and the election cycle, and we would not be concerned about the narrow difference.
It’s also important to recognize that seasonality does not have as much scope to operate with Treasuries, since returns over time are driven almost entirely by interest income. Looking back at the first chart, the spread of average monthly returns isn’t as pronounced for bonds as for stocks, even taking into account bond’s lower overall volatility.
So what are we to make of all of this? At the margin, bond seasonals make us a little less worried about a further run-up in rates as the 10-year Treasury yield moves towards the almost 5% high it hit in October of last year. But we would rather take our bearings from fundamentals, where shifting Federal Reserve (Fed) expectations are still the dominant factor. From that perspective, it’s hard not to see “higher for longer” as the consensus view at this point and therefore largely priced in. That doesn’t imply downward pressure on rates in itself, but it does mean the risk of even higher rates is limited at this point. If that turns out to be true, as helpful as it may be for bonds, it would likely be even more helpful for stocks.
For more content by Barry Gilbert, VP, Asset Allocation Strategist click here.
02223429-0524-A


