Asset allocation is traditionally conceived in a mean-variance framework pioneered by Harry Markowitz, where an investor strives to maximize the expected return for a given level of risk.
However, this conventional approach does not consider three important aspects of investing:
- An investor’s behavior
- Asset allocation for a goals-based financial plan with a time horizon
- The trade-off between current and future spending
Daniel Kahneman, a Nobel Prize winner in behavioral finance, argued that investors are not always rational in their decision making, saying, “Economists think about what people ought to do. Psychologists watch what they actually do.”
Accounting for these behavior gaps is the essence of the bucketing approach to financial planning.
Mental Accounting
One of the major behavior gaps the bucketing approach tries to alleviate is mental accounting, the theory that people treat money differently depending on its origin and intended use. Investors are susceptible to this bias when they view recent gains as “house money” that can be used for high-risk investments, according to Richard Thaler’s study “Mental Accounting Matters.”
The bucketing strategy lays the foundation for goals-based allocation, which provides a tractable shortcut to overcoming a one-number risk in a portfolio. This approach divides a client’s portfolio into several “buckets,” each with different goals, time horizons and risk levels. Each bucket is driven by a separate asset allocation policy that creates a case-by-case, tailored solution that reflects a client’s financial plan.
Time Diversification of Risk
The bucketing strategy also infuses “time diversification,” the theory that there is an inherent relationship between the holding period and risk – the volatility of risky assets falls over long periods of time.
This has long been debated in academia with the acceptance of what is known as “mean reversion” of returns. Several theories are used to explain mean reversion in stock prices, but ultimately it’s said that an upward price movement is likely to follow a decline in stock prices, and vice versa.
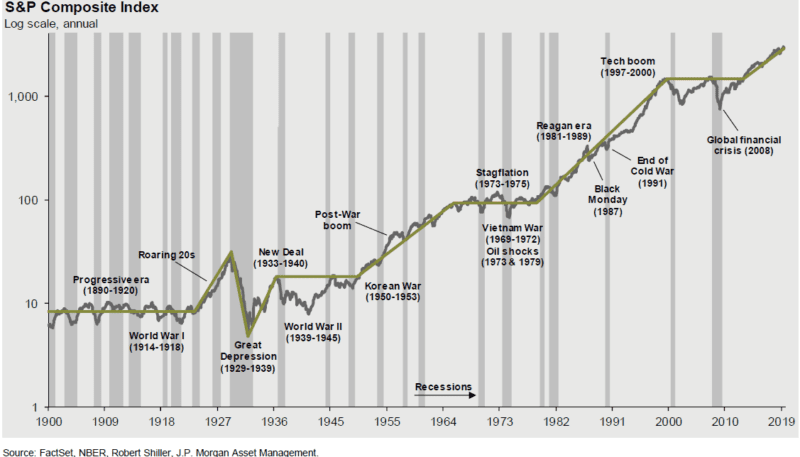
The variance of stock returns is less than proportional to the time horizon, which supports the case that stocks are less risky over the long-run, as evident by the S&P Composite Index (charted below).
J.P. Morgan Guide to Markets 4Q 2019 as of September 30, 2019
Even in a shorter cycle, S&P annual returns are positive in the last 29 out of 30 years despite an average intra-year decline of 13.9%. Studies indicate that short-term focused investors lost over 60% of the returns available in their time horizon due to poor market timing, which was driven by emotional decision-making with greed or fear as a factor.
The Sequence of Returns Paradox
Sequence of returns has become essential to determining the ending value of portfolio wealth. Sequence of returns risk relates to the heightened vulnerability that retirees face with the realized investment portfolio returns in the years around their retirement date.
Moshe A. Milevsky and Alexandra C. Macqueen wrote in “Pensionize Your Nest Egg” that investors are most at risk from a negative sequence of returns during what is called the “retirement risk zone” – the years immediately preceding or following retirement. Many who retired around the recession in 2008 experienced this. The retiree has the largest nest egg at hand with a shorter time horizon to recoup the losses from market downturns.
However, Milevsky and Macqueen claim that the bucketing approach gives an illusion of safety because an investor draws from a near-term bucket of cash or cash equivalents and empties it, and the longer-term bucket allocation drifts toward more equities with higher volatility.
This implies the bucketing portfolio is somewhat less exposed to equity risk at the beginning, when withdrawals are taken from the less risky assets, and more exposed to equity volatility toward the end of the period.
Testing the Efficacy
To model the portfolio construction, let’s simulate and compare the results of a traditional 60/40 portfolio with a 4% systematic withdrawal to a two-bucket portfolio that invests 40% in Bucket 1 and 60% in Bucket 2.
There is a waterfall distribution from Bucket 2 to refill Bucket 1 at the end of each year over a 20-year time horizon.
Traditional Portfolio Construction
- I created a portfolio with an initial investment of $1 million – $600,000 invested in SPDR S&P 500 ETF Trust (SPY), $300,000 invested in iShares Barclays Aggregate Bond (AGG), and $100,000 invested in iShares Barclays 1-3 year Treasury (SHY). The parameters of the traditional portfolio modeling are in the appendix.
- I assumed a 4% withdrawal of the initial amount, or $40,000 every year over a 20-year period (adjusted for inflation). The simulation results are in the appendix.
- The simulation model for the traditional portfolio results in about a 66% chance of losing $1 million after 20 years. The terminal wealth stood at $781,000 at the 50th percentile and $2.075 million at the 95th percentile after 20 years.
Bucketing Portfolio Construction
The Bucketing portfolio was constructed with an initial investment of $1 million, allocated as follows:
The parameters of the bucketing portfolio model are in the appendix.In other words, there is no difference in investment between traditional and bucketing portfolio other than splitting the funds into two buckets.
- The cash flows in the bucketing portfolio are modeled as follows:
- The dividend from SPY (assumed at 2%) is used to refill Bucket 1.
- Bucket 1 would distribute $27,750 per year toward systematic withdrawal.
- Bucket 2 would distribute the shortfall of $12,250 per year to support the systematic withdrawal of 4% per year (or $40,000, adjusted for inflation).
- The simulation model for the bucketing portfolio results in a 16% probability of running out of money in Bucket 1 and a 33% chance of losing the principal value of Bucket 2 after 20 years. The terminal wealth stood at $871,000 at the 50th percentile and $2.65 million at the 95th percentile after 20 years. These numbers were $781,000 and $2.075 million, respectively for the traditional portfolio. (Simulation results are shown in the appendix.)
Observations
- Bucketing portfolio increased the probability of meeting the goals. In the traditional portfolio, after 20 years and a 4% systematic withdrawal, there was a 33% chance of preserving $1 million. This increased to a 66% chance of preserving Bucket 2 ($600,000) with an 84% probability of not running out of money in Bucket 1 ($400,000).
- Bucketing approach considers investors’ behaviors as perspective changes. In a traditional portfolio, an investor is concerned whether the principal will fall below $1 million, whereas in a bucketing portfolio, this concern is only applied to Bucket 1 and not the entire portfolio.
- Bucket 1 is earmarked for supporting the withdrawal and therefore invested in a conservative portfolio (1.5% return with 3% risk), whereas Bucket 2 is positioned for growth (7.5% return – after taking out the assumed dividend of 2% per year – with 15.5% risk).
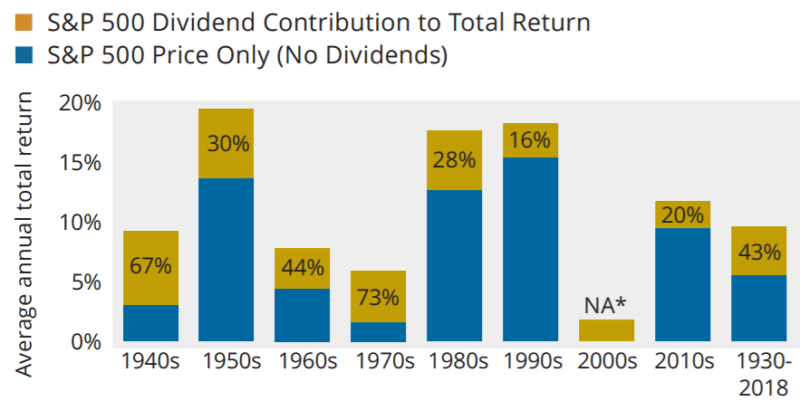
- Research indicates that dividend income accounts average 43% of the S&P 500 Index and are less volatile than the price fluctuation. Dividends were out of investors’ focus in the 1990s, but they turned their attention to dividends after the dot-com bubble. In the Bucketing portfolio, we have taken the distribution out to support the systematic withdrawal from Bucket 1.
- The wealth distribution of the bucketing portfolio is positively skewed compared to the traditional portfolio. The terminal wealth of the traditional portfolio increased by almost $90,000 in the 50th percentile and $574,000 in the 95th percentile in a bucketing portfolio.
Source : Hartford Funds Research
Key Takeaways
- The bucketing approach to investing has emerged as an asset allocation methodology in the financial planning and advisory community because it’s specifically designed to account for investor behavior, which helps manage expectations. In a market downturn, the investor in a traditional portfolio is concerned about the decline of the entire principal amount, whereas in a bucketing approach, the investor is likely focused near-term with Bucket 1 and longer-term with Bucket 2. This implicitly takes the concept of “Time Diversification of Risk” into consideration, where patience serves as a protection against emotional decision-making.
- The bucket earmarked to support spending should be invested in a lower risk portfolio compared to the bucket designated for portfolio growth. In the modeling exercise, we extended both buckets to 20 years to compare the results with the traditional portfolio. However, in- reality, Bucket 1 is managed over a shorter time horizon than Bucket 2.
- The key factor is managing the cash flows with distribution and adjustment of load between the buckets. It is imperative to refill the near-term bucket, which can be done in one of two ways. In the “waterfall” bucket approach, Bucket 1 is replenished annually with flows from the longer-term bucket (e.g. Bucket 2). The other approach is the “wasting” bucket, where Bucket 1 is drained before refilling from Bucket 2. In our model, we balanced the load in three ways:
- Taking the dividend from Bucket 2 to refill Bucket 1.
- Taking the maximum amount of withdrawal every year from Bucket 1 while minimizing the probability of running out of money (16% for Bucket 1 in our example).
- The balance is supported by Bucket 2 with the highest possible probability of capital preservation of Bucket 2 principle (about 67% for Bucket 2 in our example).
Closing Thoughts
Accounting for investor behavior is an important part of financial planning, and the bucketing approach is one way to account for this factor.
While bucketing can vary depending on the number of buckets, the length of time and the risk level of each bucket, it is an effective strategy to alleviate sequence of returns risk and protect against emotional reactions to the market.
Appendix
Traditional Portfolio
Model Parameters
Expected Return: Black Litterman (October 2003 to November 2019)
Wealth PercentilesSimulation Results
Probability of Capital Preservation
Bucketing Portfolio
Model Parameters
Expected Return: Black Litterman (October 2003 to November 2019)
Black Litterman uses a reverse optimization method, which results in implied return for the asset classes. The implied return is dependent on market capitalization and other factors of the other assets in the mix. The implied return of SPY was slightly different in the bucketing portfolio compared to the traditional portfolio model. The expected return of SPY was reduced to 7.50% in the model to account for 2% waterfall distribution to refill Bucket 1.
Simulation Results
Wealth Percentiles
Probability of Capital Preservation


