Poor consumer confidence has been bit of a puzzle recently, given historically low unemployment and easing inflation. In fact, the “misery index,” which is the sum of the inflation rate and the unemployment rate, looks quite normal. It sits at 7.3% as of April, which is below the historical average (1950-2023) of 9.3%.
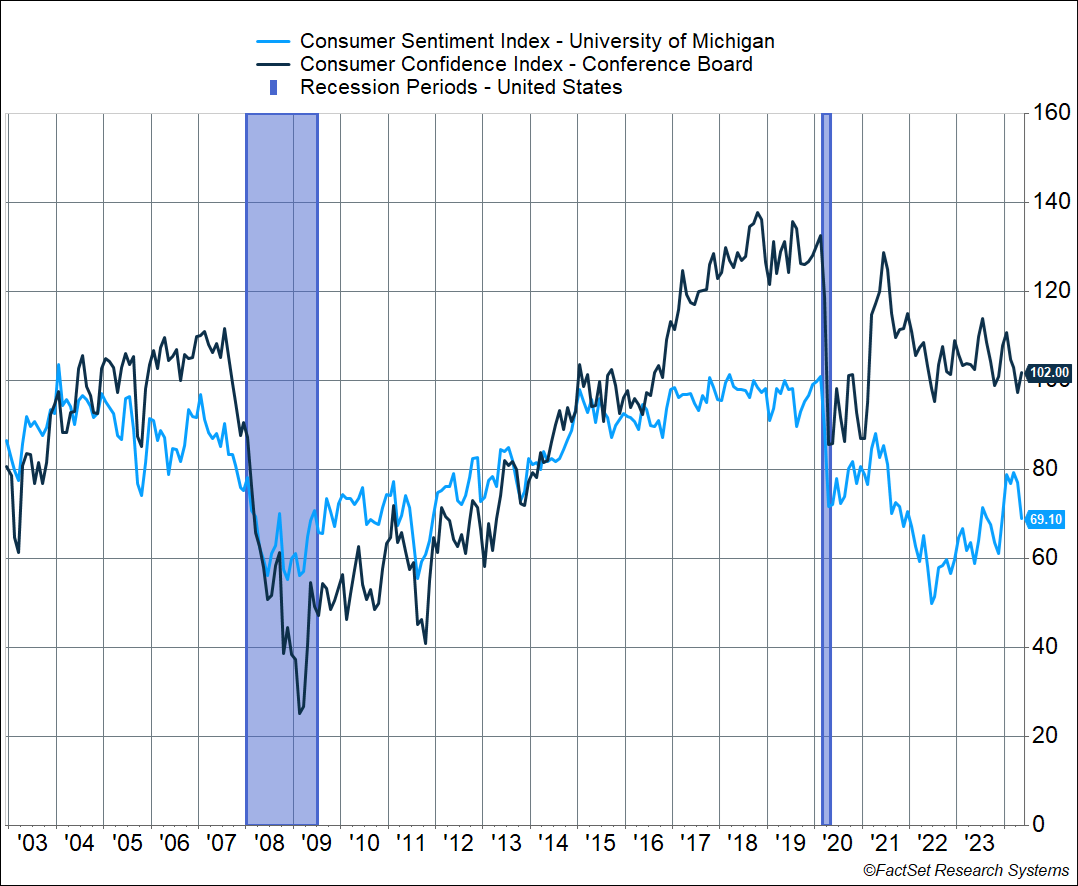
Meanwhile, consumer confidence sits well below what you’d expect given where the misery index is. The University of Michigan Index of Consumer Sentiment is well below where it was during the depths of the pandemic, and not far above where it was during the 2008 crisis. Puzzling indeed. A better look is from the Conference Board’s Index of Consumer Confidence, which recently rose in May. That index is in the range of what we saw during the 2003-2007 expansion and is comparable to what we saw back in 2016.
As I’ve written in the past, consumer confidence tends to be impacted by gas prices. Gas prices rose from January through April, which may explain some of the weakness, though prices have been easing over the past month (good news). The University of Michigan survey may also be impacted by political preferences, i.e. “the economy’s bad because our guy is not in power.”
The Conference Board version is more tuned to the job market, and it has a helpful breakdown of its underlying components.
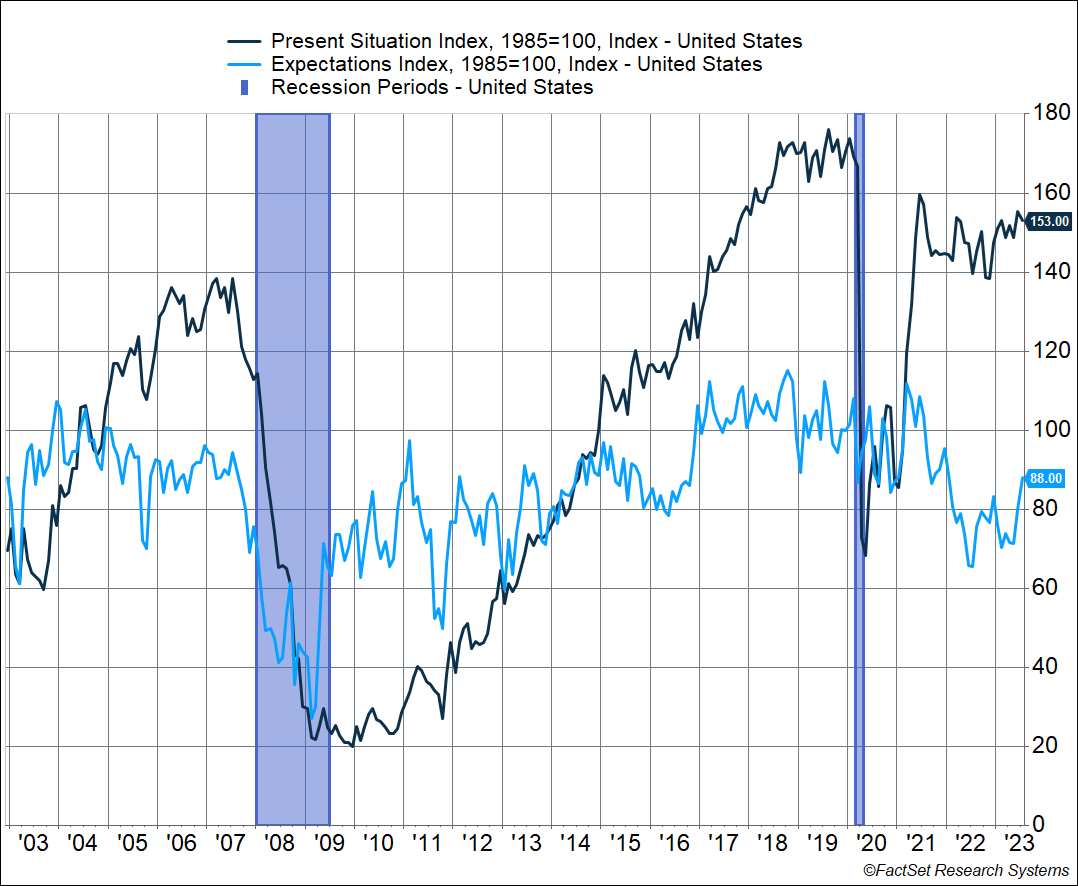
One is the “present situation” index, which is based on consumers’ assessment of current business and labor market conditions. This index is currently sitting below 2018-2019 levels but in line with what we saw in 2017, when the economy was strengthening. And it’s also above the highest levels we saw during the 2003-2007 expansion. In short, consumers feel pretty good about the current economic situation.
The other part is the “expectations” index, which is based on consumers’ short-term outlook for income, business, and labor market conditions. That’s sitting below where it was during the 2014-2019 period and below the mid-2000s expansion levels as well. It’s this component that is pulling the headline Conference Board index lower because consumers are not feeling good about what may be coming ahead.
The disconnect between consumers’ assessment of their current situation versus future expectations, and even the state of the national economy, has been found in other surveys too. It can be hard to parse through the exact reasons why this is. Several articles have recently attributed poor confidence to the cumulative rise in inflation since the pandemic (like this one). Prices, as measured by the headline Consumer Price Index (CPI) are up 21% since February 2020 through April 2024. But as I noted, consumers say their personal situation is fine.
Yet, one thing I read recently had me thinking …

Stay on Top of Market Trends
The Carson Investment Research newsletter offers up-to-date market news, analysis and insights. Subscribe today!
"*" indicates required fields
A Lot of Households Are Stuck
Americans are quite literally stuck in their homes, as this New York Times piece points out. Mobility is a key part of the American dream, and the most salient aspect of that is buying a home as you start a family. Or, if you already own a home, selling that and buying a larger one as your family expands. Well, that’s not easy now, for a couple of reasons:
- Mortgage rates are at 7%, the highest level in more than 20 years, thanks to the Federal Reserve’s interest rate hikes.
- Inventory levels have plummeted, as homeowners who have ultra-low mortgage rates of 2-4% (about 6 in 10 of homeowners) are understandably reluctant to put their home on the market and buy another home at a higher mortgage rate.
Yes, home prices have risen to record levels, and that means homeowners (who make up a majority 66% of American households) have a lot of equity. Historically, that equity serves as the foundation to buy a new, perhaps larger, home, or even upgrade parts of their home. But right now, that equity cannot be easily accessed – assuming you don’t want to give up a 3% mortgage rate for a 7% rate. That makes households feel “locked in.”
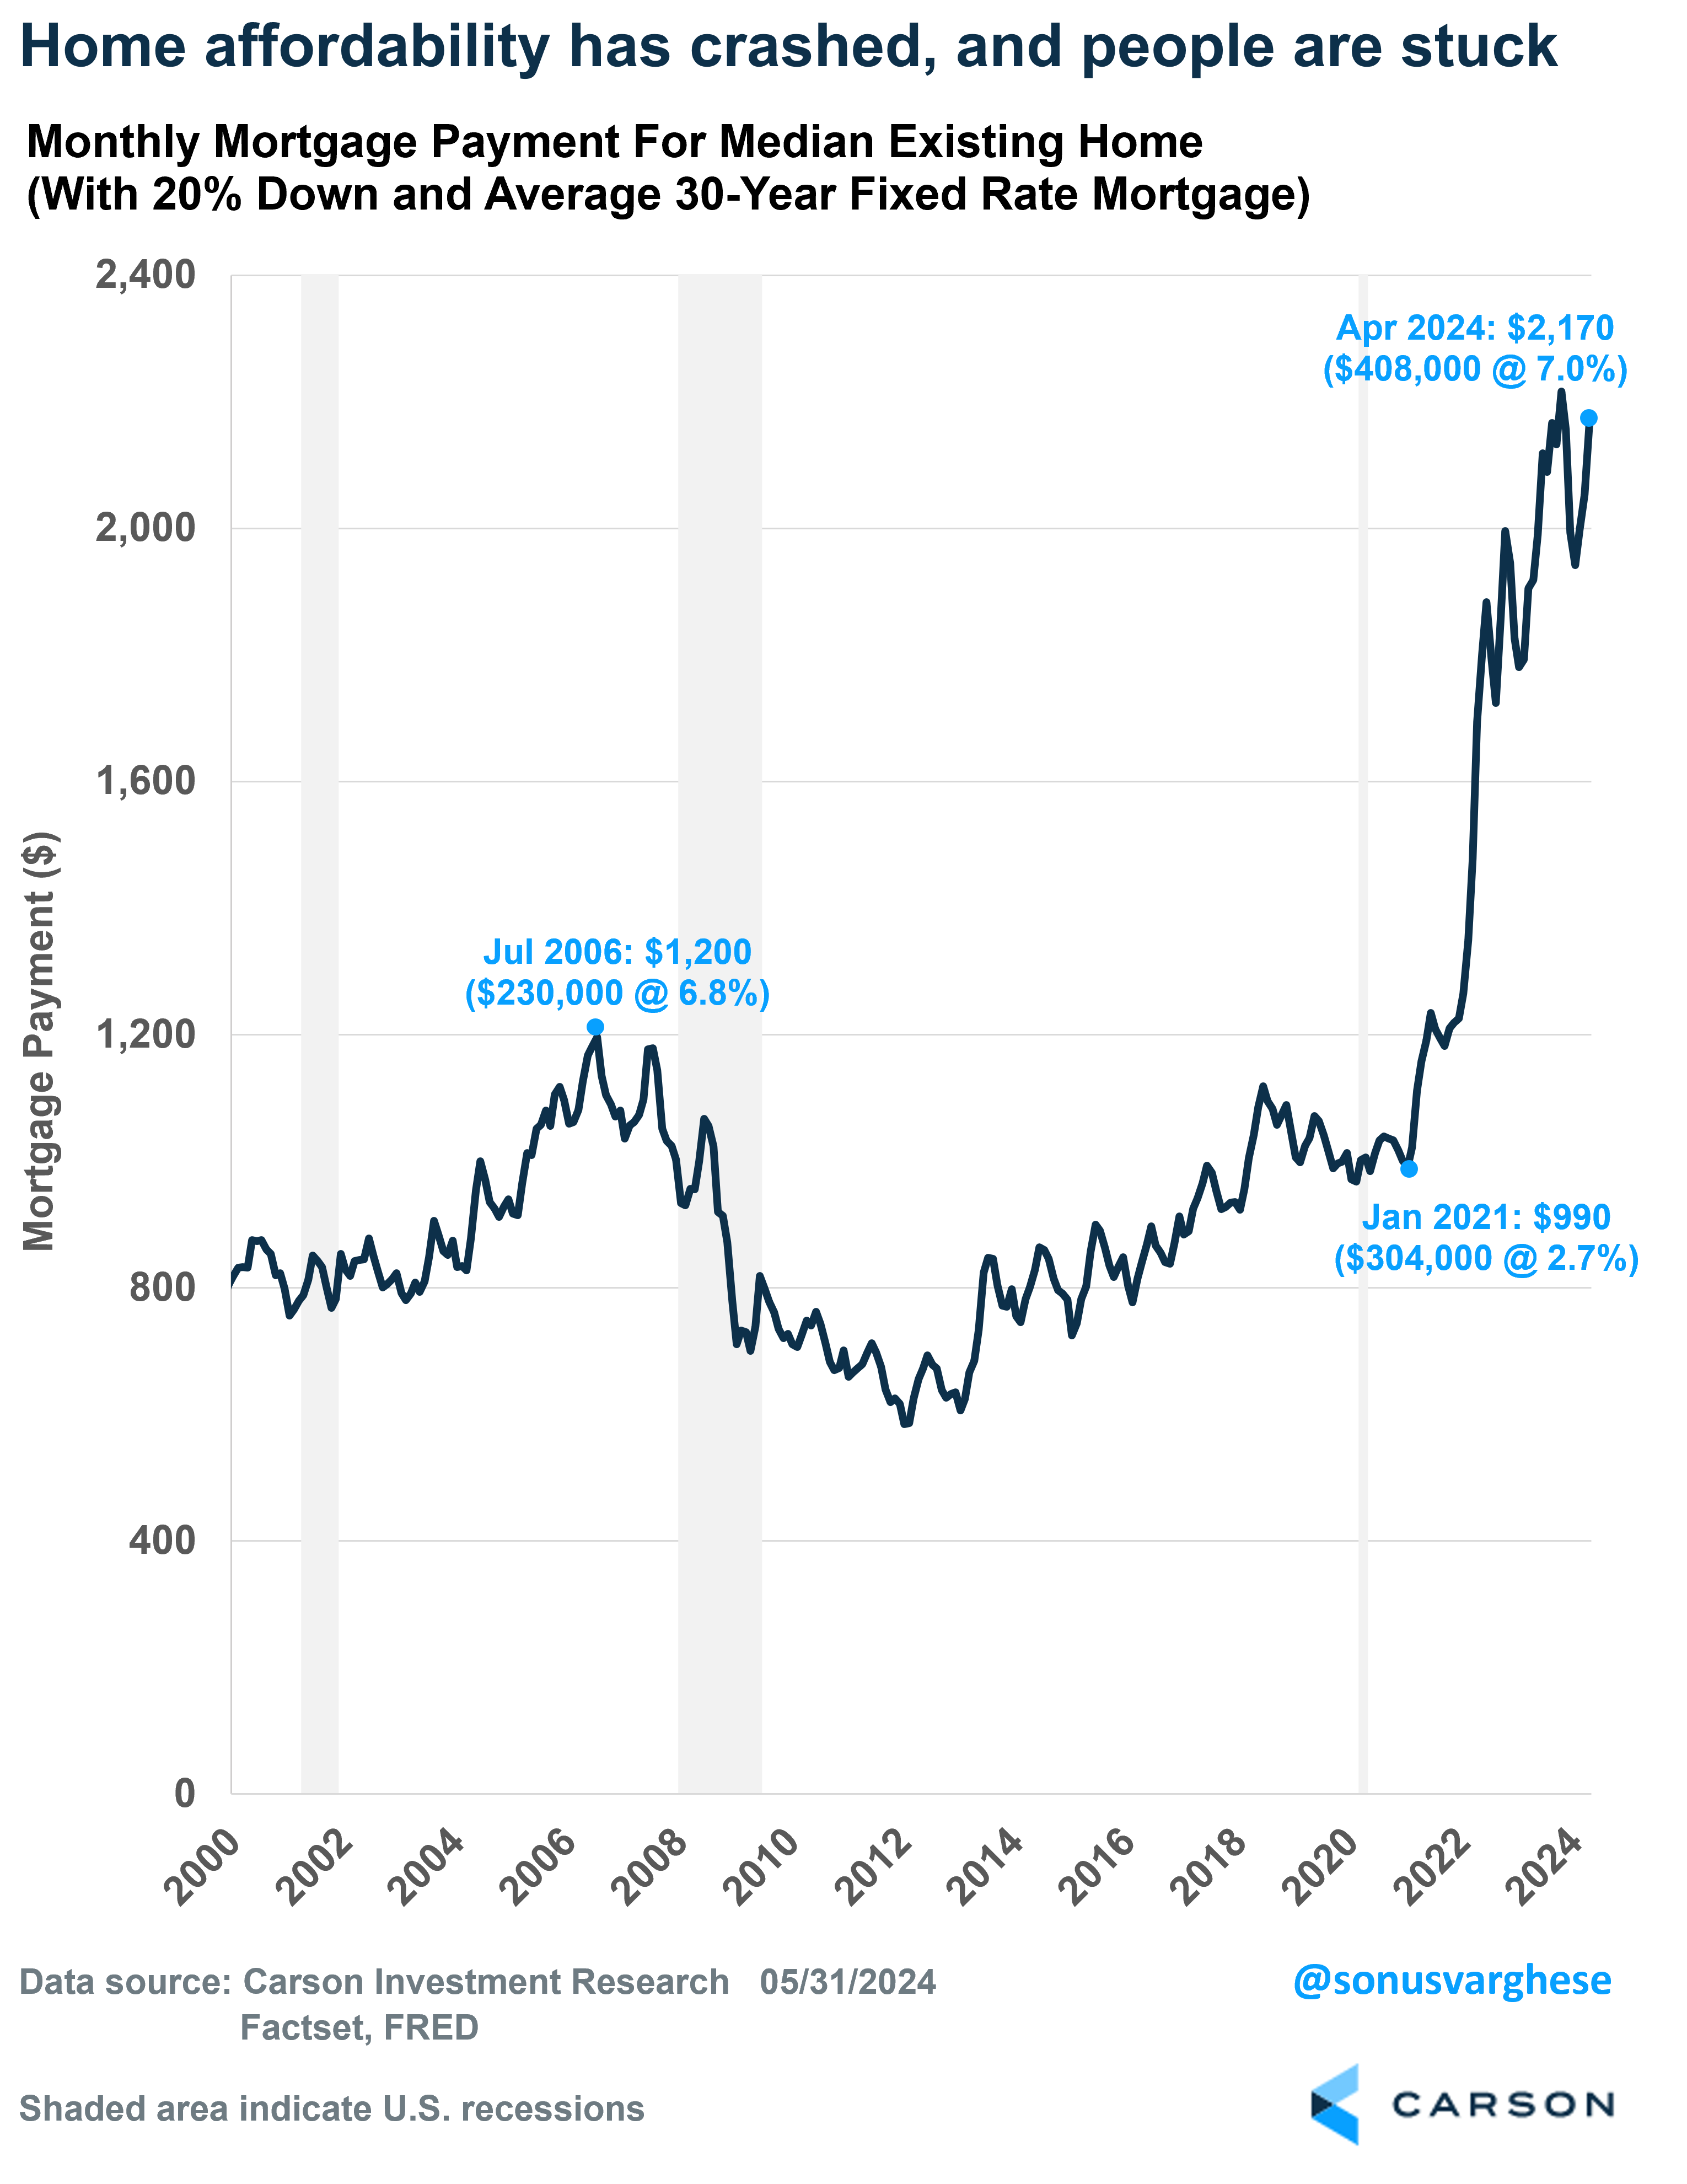
Home affordability has plunged as a result. Back in January 2021, a 20% down payment on a median home priced at $304,000 and a 2.7% mortgage rate would translate to a monthly mortgage payment of just under $1,000. The median price of a home has increased 34% since then, to $408,000. Combine that with a mortgage rate of 7%, and even with a 20% down payment, the monthly mortgage rate has more than doubled to $2,170. In just over 3 years. Even at the height of the housing bubble in mid-2006, when the mortgage rate was 6.8%, the monthly payment after a 20% down payment would’ve been only $1,200.
The dynamic was captured in this anecdote from that New York Times piece, which is worth quoting in full.
“A year ago, Chris and Alison Wentland were eager to sell their townhouse in the coveted Lincoln Park neighborhood of Chicago, so they hired a real estate agent who sent a photographer to take slick photos of the house, including a 3-D video that panned from room to room.
The couple’s children — then ages 2 and 6 — shared a room barely big enough to fit a crib and a twin-size bed. A year later, the children share a bunk bed and the couple haven’t even listed the house, much less bought a new one. It’s not that they can’t find buyers; they just can’t afford to sell.
“If I had an open house this weekend, within seven days we’d have an offer, if not multiple offers,” said Mr. Wentland, 38. “But the flip side to it is: What’s going to happen on the other end?”
The other end looks like this: Although they’ve been lucky enough to accrue equity thanks to rising home prices — the townhouse they bought a few years ago for $538,000 will likely fetch over $700,000 now — the same wave that lifted their home’s value has pushed other homes in their neighborhood out of reach.
For an extra bedroom in Lincoln Park, they would need to spend at least $1 million. And it would mean getting a new mortgage, foregoing their 2.25 percent rate — close to the bottom of the historic curve — for one close to 7 percent, which is hovering near a 20-year high. Their monthly interest payments would triple to at least $7,500, their agent warned.”
Right now, millennials (ages 28 – 43) are the largest adult demographic in America. That’s a prime age for home-buying and household formation. But a lot of them can’t buy starter homes, or they can’t trade up. They’re stuck, which is why things around probably don’t feel great. Buying a new home tests the limits of their income, or even if they have equity in their homes, trading up is unaffordable. Probably shouldn’t be a surprise if a good portion of Americans don’t feel great about their future prospects, and ironically, say that high interest rates have actually raised the cost of living.
How Do They Become “Unstuck”?
We’re going to need the Federal Reserve to pull back on rates, which should send mortgage rates lower, and increase housing activity and household formation. Of course, the Fed’s going to need inflation to come in softer than it did in the first quarter. The good news is that’s more likely than not over the next few months, as I wrote last week. One thing that is interesting in the face of this dynamic is that if the economy weakens temporarily, enough to push the Fed to cut rates, we could suddenly see an economic boost from all the pent-up demand related to housing. It’s a very unusual situation, but as the last few years have reminded us, these are unusual times.
For more content by Sonu Varghese, VP, Global Macro Strategist click here.
02264167-0624-A


