The stock market has been on a tear for more than 18 months now, with the S&P 500 up 44% from December 31, 2022 to July 8, 2024. We’ve consistently maintained that momentum begets momentum, and my colleague, Ryan Detrick, has written time and again as to why there’s more than enough reason to be optimistic. This momentum, along with the fact that that we never thought the economy would go into a recession, was why we went overweight equities in December 2022. In fact, in his latest blog, Ryan discusses why a good first half of 2024, with the S&P 500 up 14.5%, bodes well for the second half.
Nevertheless, it seems like there’s skepticism in a lot of places, not least because the largest technology-oriented stocks have been driving market gains, and even more so recently. In fact, a lot of investors are even worried about losses, which is true much of the time no matter what the market is doing. One way they’re acting on that is by investing in products that limit losses, so called defined outcome or “buffered” ETFs. These products use derivatives, such as options, to limit losses (which should immediately tell you they don’t come cheap). Investors have moved almost $35 billion into these kind of options-trading ETFs over the last 3 years. Just over the past year (through June 30th), these products have seen flows of over $16 billion.

Stay on Top of Market Trends
The Carson Investment Research newsletter offers up-to-date market news, analysis and insights. Subscribe today!
"*" indicates required fields
Amongst the more popular versions of this a buffered product with a 10% buffer, protecting investors against the first 10% of any loss over the following 12-month period. That means if the S&P 500 index is down 10% over a full year, the investor does not experience a loss (minus fees). If the index falls 30% over 12 months, then the investors experience a loss of 20%. You can probably see the appeal of this.
Of course, nothing is free, least of all on Wall Street. The cost comes in three forms:
- The straight-up expense ratio of the ETF, which is typically at least 0.75% or more
- The products don’t pay dividends, which means you’re losing out on returns of about 1.2% per year (which compounds over time too)
- Your upside is capped, and the cap can vary. For the example above, for a 10% buffer, your upside can be capped around 15%
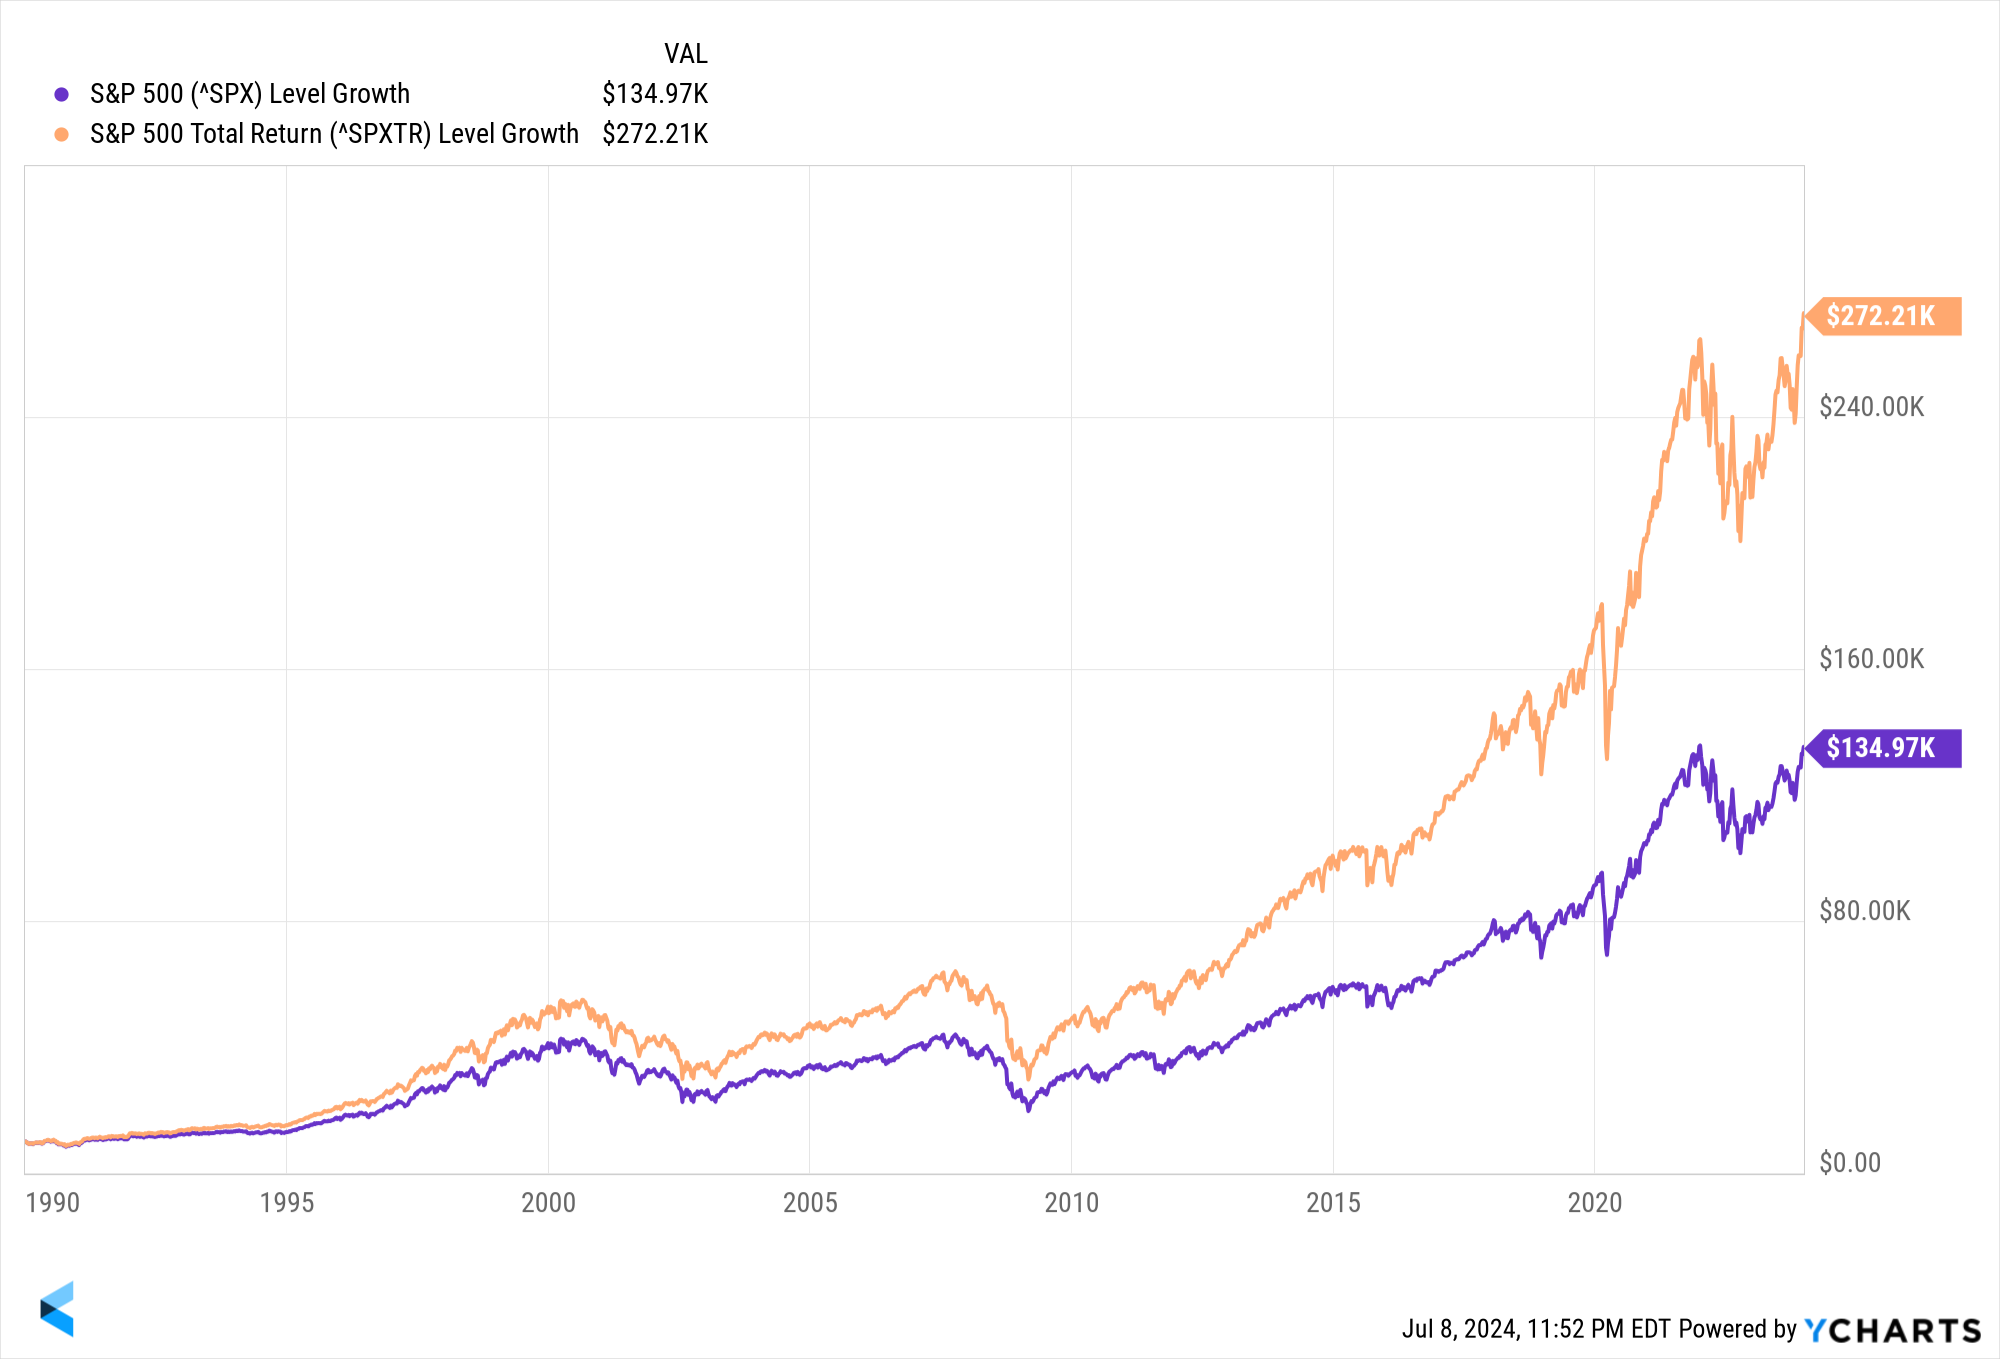
On not receiving dividends: from 1990 through 2023 (34 years), the price return for the S&P 500 (excluding dividends) was 8% per year. So, $10,000 invested at the end of 1989 would’ve grown to $135,000 by the end of 2023. However, the “total return,” including dividends, was 10.1% per year. The same $10,000 would’ve grown to $272,000. That’s a huge difference, to put it mildly.
Don’t Miss the Best Years of the Market
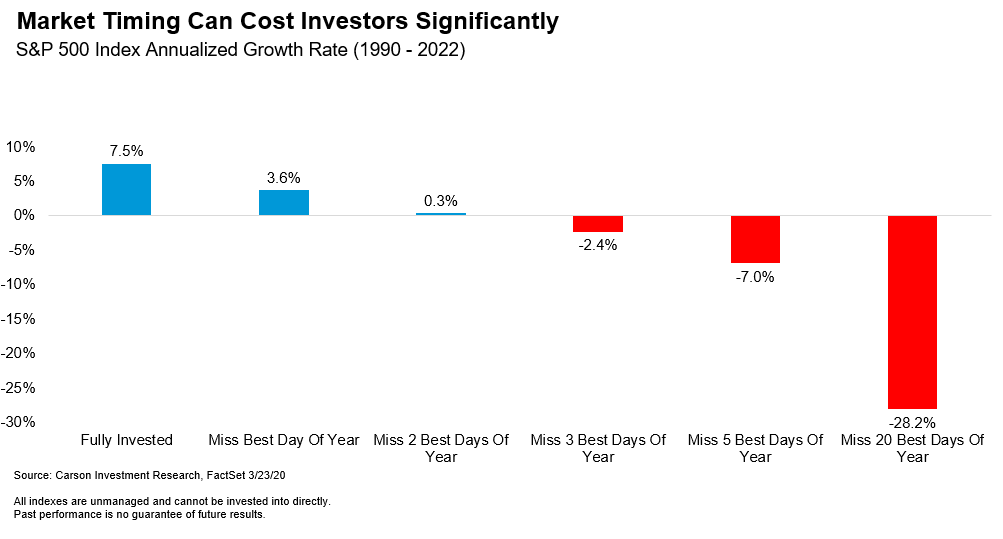
A very commonly shared chart in the investment industry shows stock market returns if you missed the best market days each year. As my colleague, Barry Gilbert, wrote, the point of the chart is straightforward and captures the old market saw that “time in the market” is more important than “timing the market.” It highlights the risks associated with market timing.
Of course, as Barry pointed out, investors don’t jump constantly in and out of the market on a day-to-day basis, and so would not be at risk of missing the best one, two, or five days of the year. However, investors could very well be at the risk of missing out on some huge years when using buffered products that still have a lot of downside (even after the buffer), but limits the upside.
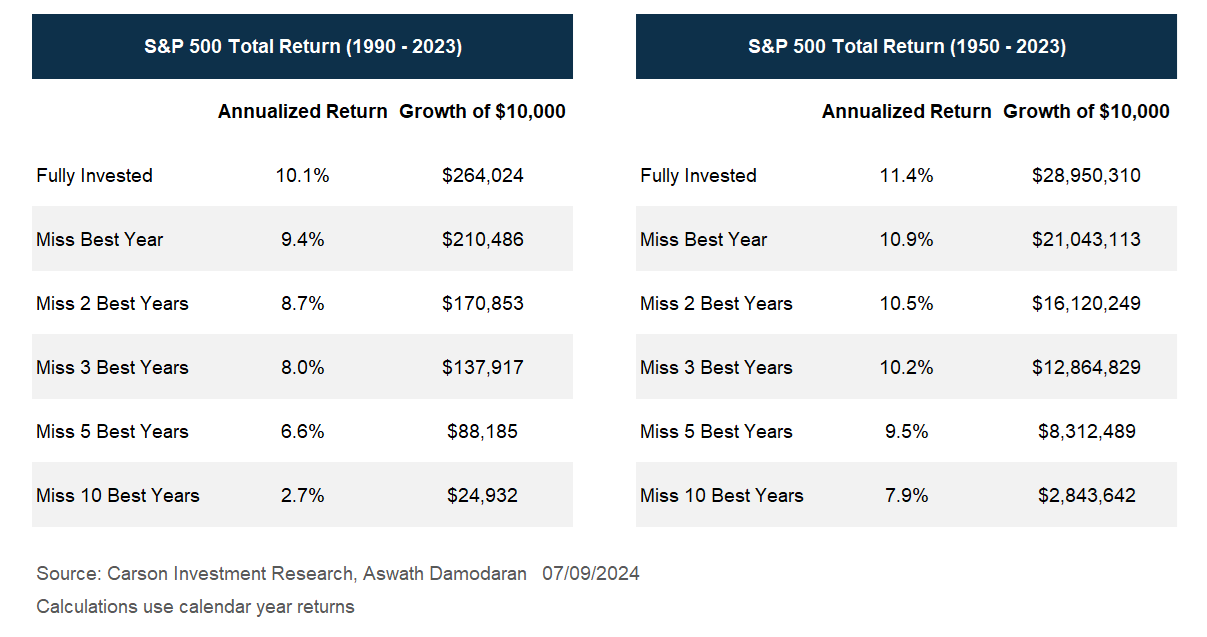
Looking at annual returns for the S&P 500 from 1990 through 2023, the annualized return was 10.1%. That drops to 9.4% if you missed the best year (which was 1995, when the S&P 500 gained 37%). If you missed the 5 best years, the annualized return drops to 6.6%. And you averaged only 2.7% if you missed the 10 best years. Being fully invested from 1990 – 2023 means $10,000 would grow to $264,000. Whereas if you missed the 10 best years, the same $10,000 would have grown to $25,000. The table below also shows numbers with the time horizon expanded back to 1950.
Don’t Lock Yourself into Poor Outcomes
You may be saying “Sure, I’d have missed the best years, but I’d have gotten some protection in years like 2001 and 2008.”
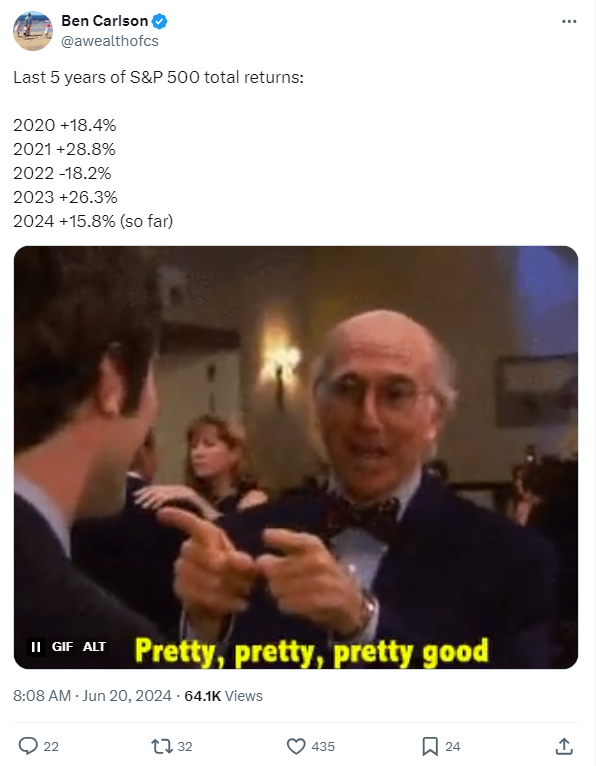
Here’s a recent tweet from Ben Carlson, showing S&P 500 (total) returns for the last 5 years. As the meme says: “Pretty, pretty, pretty good,” unless you capped returns at 15% each year.
Replicating a product with a 10% buffer and a 15% cap, and assuming 0.50% fees per year, the total return from 2019 to 2023 (5 years) would have been 54%. That’s not bad, except that if you invested in the S&P 500, the equivalent return would be 106%.
There’s more. You could have invested just half your money in the S&P 500 and the remaining in cash (Treasury bills), and assuming you rebalanced that once a year, the total return from 2020-2024 would be 55%. Except with the 50% S&P 500 / 50% cash portfolio, you didn’t limit your upside. And you still cut downside exposure by half, i.e. if the S&P 500 fell 30% in a year, this portfolio would have been down 15% (actually less, since you’d have earned something on cash, and received dividends).
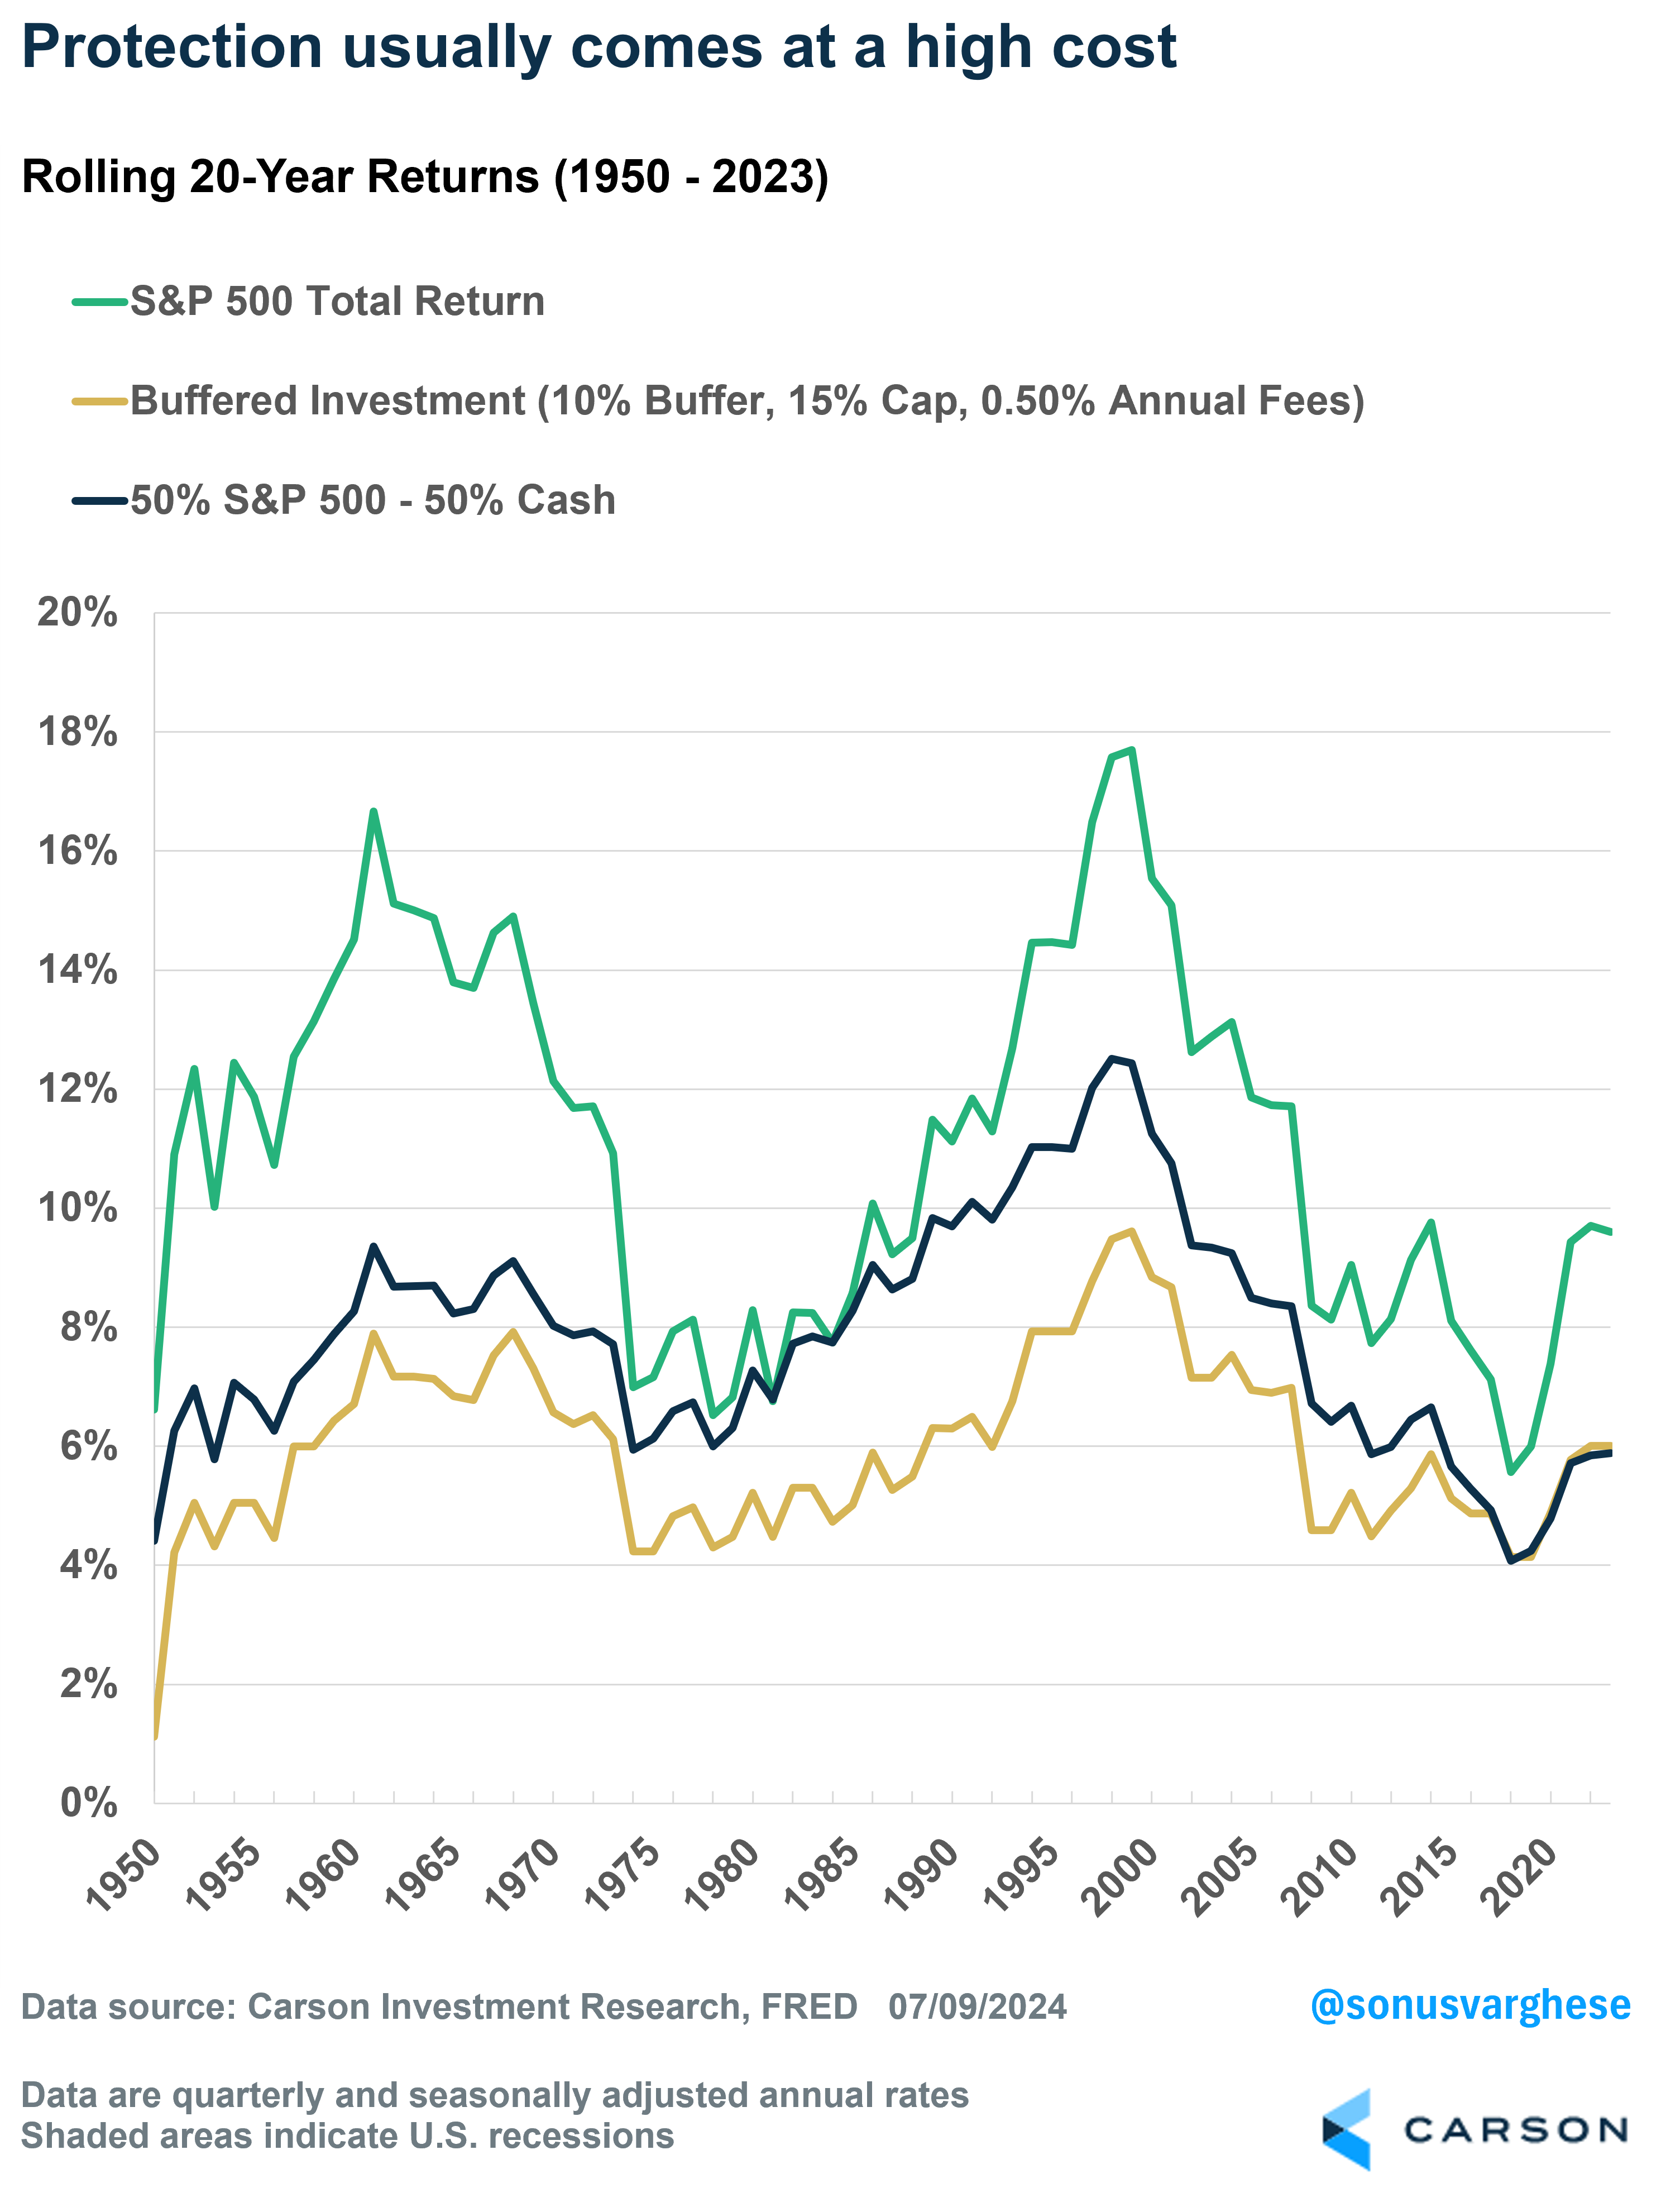
Going all the way back to 1950, I looked at rolling 20-year periods, comparing a 100% investment in the S&P 500 vs a replicated buffered product (10% buffer, 15% cap, 0.5% fees – fairly generous terms relative to what’s on the market now). I also included a 50% S&P 500 – 50% cash portfolio. The chart below shows annualized rolling returns over 20-year periods from 1950 (looking backwards). As you can see, the S&P 500 has outperformed the buffered investment in every single period, which is not unexpected. But even a 50% S&P 500 – 50% cash portfolio has outperformed it across almost all these 20-year periods (in 69 out of 74 periods), with the same level of volatility. Even in those 5 periods when the buffered investment beat the stocks-cash portfolio, it was by just about 0.1%-0.2% per year.
Here are average annualized returns across each of these 20-year periods:
- S&P 500: 11.0%
- Buffered investment: 6.0%
- 50% S&P 500 – 50% cash: 7.8%
Stocks are a great investment over the long-term, especially after adjusting for inflation. Of course, it comes with volatility – that’s the “price you pay” for excess returns. But if you wanted to dampen this volatility, and “protect the portfolio,” cash (Treasury bills) is likely just as good, or better, than typical protection products. Of course, if cash is hardly paying anything (like in most of the past decade), it’s not great, but that’s far from the case now.
For more content by Sonu Varghese, VP, Global Macro Strategist click here.
02313467-0724-A

