The pandemic and post-pandemic environment has been a breeding ground of economic anomalies born out of deep disruptions and policy extremes that have echoed across the years. That doesn’t mean good economic analysis doesn’t hold true; it does mean that good analysis takes some extra work. You couldn’t just paint by numbers over the last several years. You had to think a little bit about how you’re counting things up and what the “true count” is given the unusual circumstances. My colleagues Sonu Varghese, VP, Global Macro Strategist, and Ryan Detrick, Chief Market Strategist, have had a keen eye for the numbers that mattered over the last couple of years, cutting across the onslaught of doomsaying charts that treated the environment as “business as usual.”
Writing on the eve of the Fed’s first rate cut of the cycle, I thought I would take a quick look at the latest harbinger of doom making the rounds. The yield curve has uninverted. What does that mean? The 10-year Treasury yield is normally higher than the 2-year Treasury yield. Investors expect a higher yield for a bond whose maturity is further out. Since June 1976, the 10-year has been above the 2-year 83% of the time. When the 2-year yield moves above the 10-year, called yield curve inversion, it’s usually a sign that markets expect the Fed to get more aggressive, and sometimes, to a lesser extent, that the economy may weaken.
Much was made of the yield curve inverting back in July of 2022. But the bear market bottomed three months later and the expansion continued. In fact, real GDP grew at an annualized pace of 2.8% over the two years since July 2022, above the 2010-2019 average of 2.4% and the S&P 500 rose over 40% from July 31, 2022 to August 31, 2024. Much was made of the inversion reaching more than 1% for the first time since 1981 in June of 2023. Markets pressed higher and the expansion continued. By our measure the yield curve uninverted (assuming it stays that way) on Friday, September 6, 2024. (It had uninverted a little earlier but had inverted again.) What happens next?
Like inversion, uninversion (or reversion, or yield curve normalization) is a reflection of what investors expect the Fed to do. A curve that has uninverted means investors expect the Fed to lower interest rates. It could probably be a stronger sign of economic risk than inversion, but historically, the Fed’s been behind the curve and was playing catch up – economic data was already deteriorating by the time the Fed started lowering rates (e.g. 1990, 2001, 2007, 2020). In other words, you can’t paint by numbers.
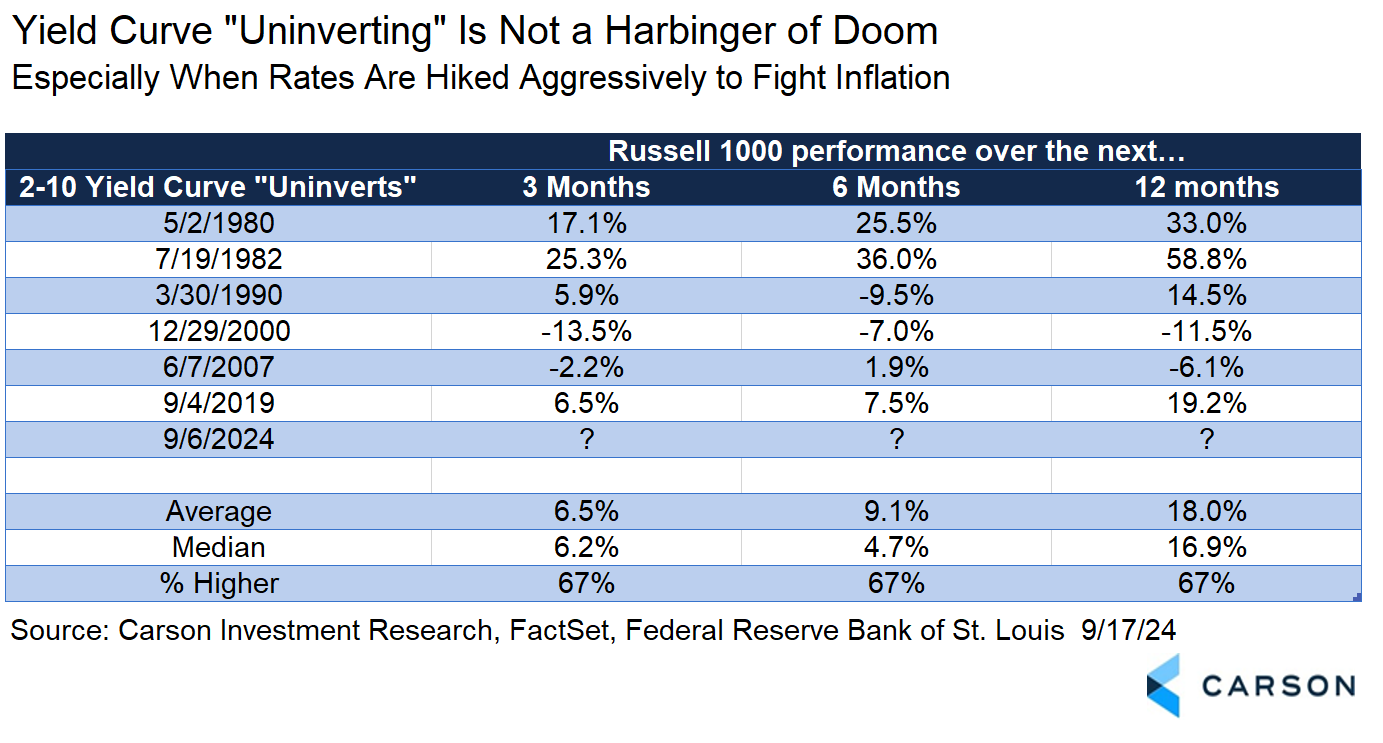
Even with that, uninversion hasn’t meant a lot for stocks. We looked at the date the yield curve uninverted around the last six recessions (all the history we had). It’s a small sample, but at the very least it tells us that uninversion hasn’t spelled doom for markets. To the contrary, the one-year numbers historically are actually pretty good, up a median of 17%.
We can’t ignore the risks. Labor market trends have turned negative increasing the possibility of an economic downturn. However, we still think a Federal Reserve that is at least moderately aggressive about lowering currently restrictive rates can avoid falling behind the curve. How restrictive are we now? In 2019 a fed funds rate of just 2.5% was considered high enough to break a pretty good economy and the Fed had to make a mid-cycle adjustment. The fed funds rate is at 5.5% now, a meaningful hurdle for economic expansion, but the economy has actually held up quite well. The Fed’s current aggressive efforts to control inflation were needed, but with inflation under control and job gains slowing, highly restrictive rates can do unnecessary damage to the economy whether or not it causes a recession.
In the table above, stock gains were strongest despite uninversion in the early 80s. While we don’t think the current situation is completely analogous to the early 80s, there are some common factors. The current hiking cycle is the most aggressive since the early 80s. The motivation was also similar—the focus was on inflation, not necessarily an economy that was overheating. The 80s had their own market drivers, but we do think market resilience in response to an aggressive Fed has some parallels.
Each uninversion in the table above was in fact associated with a market drawdown of at least 15%, but that just shows how difficult it is to time drawdowns. And if you think, “Oh, I’ll buy near the bottom,” be aware that this would be very atypical investor behavior. As Ryan often likes to say, investing is the only place where everyone runs out of the store screaming when things go on sale.
Stay on Top of Market Trends
The Carson Investment Research newsletter offers up-to-date market news, analysis and insights. Subscribe today!
"*" indicates required fields
If your concern isn’t markets, uninversion has done ok as a recession warning but it’s been highly variable. In the 1980s, uninversion actually came after the recession started, unlike the other four cases. If the current situation ends up being somewhat parallel, you could point to the 2022 bear market as the primary response to Fed rate hikes, which started back in March 2022.
In the other four cases, uninversion was a pretty good signal, but we don’t think we’re on the verge of a global pandemic, or a 100-year financial crisis, or even tech bubble valuation extremes. (We have had two bear markets in the last five years after all.) Uninversion likely just reflects the fact that the Fed is going to normalize interest rates after raising them to very restrictive levels last year. The bottom line is that uninversion may signal the need for more vigilance, but if you needed the yield curve to tell you that you just haven’t been paying attention. But it should not dictate your investment decisions.
For more content by Barry Gilbert, VP, Asset Allocation Strategist click here.
02413968-0924-A