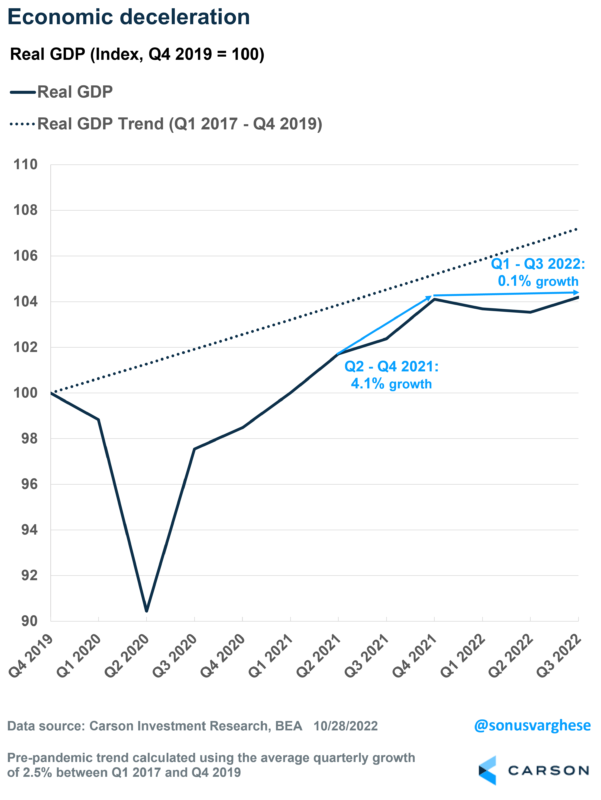
On the face of it, the third quarter GDP report was very positive, with growth rebounding to 2.6% quarter-over-quarter (annualized). This put at bay the question of whether the economy was in a recession, though admittedly a lot of these numbers can and will be revised in the future. But make no mistake, growth has slowed considerably this year – the economy grew 0.1% over the first three quarters of this year, compared to 4.1% over the last three quarters of 2021. You can see this slowing in the chart below.
A bifurcation under the hood
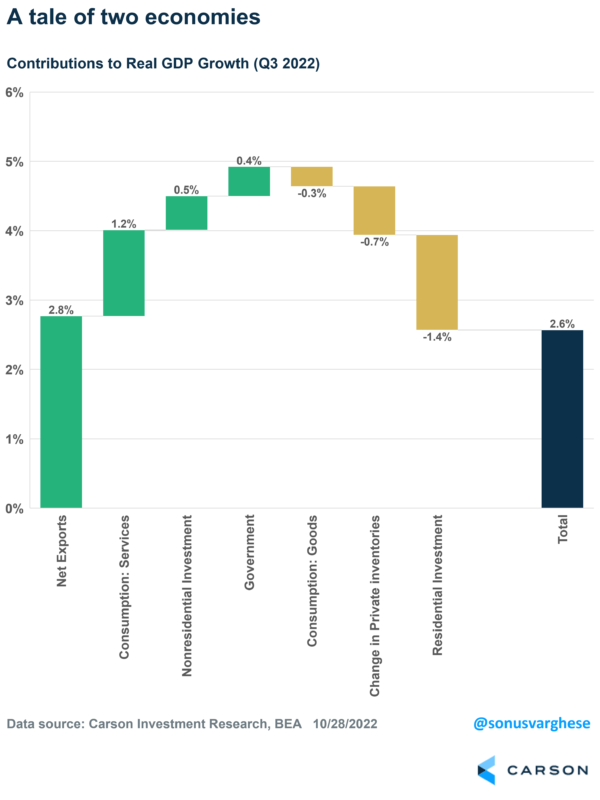
As with a lot of these numbers, it’s always useful to see what’s going on under the hood. In this case, a breakdown of how the various major components of GDP contributed to growth in the third quarter.
The biggest single contributor to GDP growth was “Net Exports”, which is exports minus imports. Exports surged 14% during the quarter (annualized rate) even as good imports fell by almost 9%, as foreigners bought more US goods and services even as Americans cut back on goods spending. This category tends to be volatile and so it’s always good to look at everything else.
It was two competing stories: services spending makes up about 44% of GDP and rose almost 3%. On the other side, you had residential investment, which makes up only about 3% of GDP – but it completely negated the strong services number by falling a whopping 26%!
The shift to services spending continues
As you saw above, goods consumption was a drag on GDP growth in the third quarter. Spending on goods fell about 1%, mostly driven by fewer purchases of cars, gasoline, and groceries.
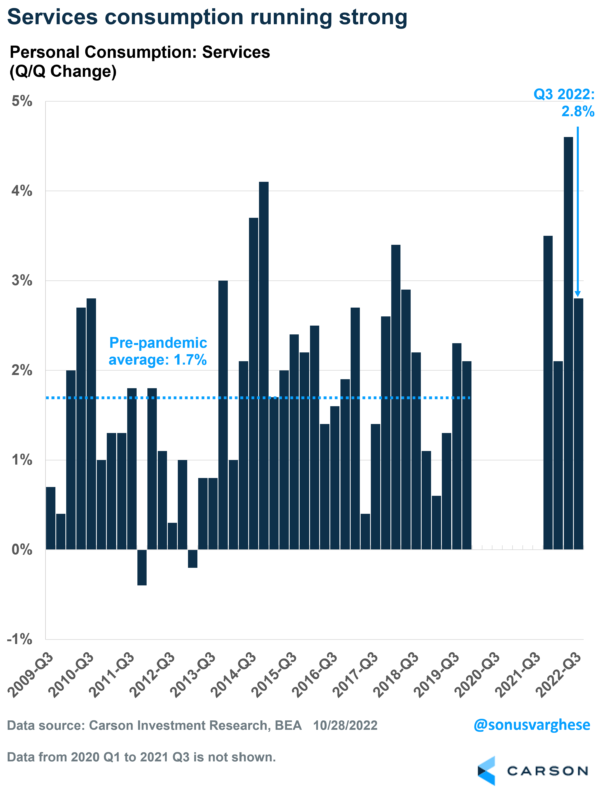
But consumers did spend – they just spent a lot on services. Now, services spending did slow from a torrid 4.6% pace in the second quarter, but that was never sustainable. For perspective, the 2.8% pace in the third quarter is well above the average pace of services spending prior to the pandemic (about 1.7%).
The Fed’s rate hikes are working to slow the economy – Via housing
The biggest story really is how much of a drag residential investment was, and that comes down to an aggressive Federal Reserve hiking rates to get on top of inflation. Rate hikes have led to a surge in mortgage rates, which in turn has led to a complete reversal of housing activity. I’ve written extensively about this over the past couple of weeks (here and here) – so not a real surprise.
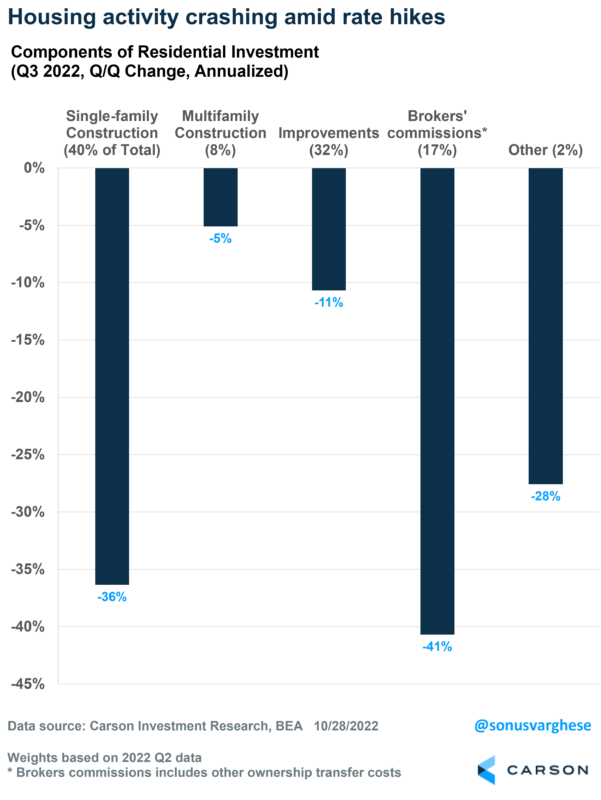
Residential investment consists of three main components: home construction (single-family and multi-unit), improvements/renovations, and broker commissions/other costs related to sales. As you can see in the chart below, each of these crashed last quarter – especially single-family construction (as builders pull back) and brokers’ commissions (as sales activity fell).
All in all, we’re looking at plunging housing activity – and expect more of this as mortgage rates rise above 7%. But for now, this is countered by households spending a lot on services, powered by rising incomes and strong balance sheets.


