With so much focus on the markets and the Fed, I thought it would be a good idea to take a quick look at where the economy is today. There are obviously 100’s of economic indicators we can use, including survey-based or “soft” data and “hard” data. The soft data is useful to gauge where things may be heading, like manufacturing or services PMI indices. Whereas the hard data tells you about what’s happening on the ground, though the cost is that it comes with a lag. Examples of hard data are employment, retail sales, industrial production, and income/consumption numbers.
We use both on the Carson Investment Research Team to get a sense of what’s happening with the economy.
Unlike the stock market, the economy is unlikely to wildly gyrate and fall off a cliff, except in the case of a pandemic. So even the hard data is useful to get an understanding of where the economy was a month ago (since these numbers come with a lag). In all likelihood that’s probably going to be the economic environment over the very near future as well, i.e. over the next couple of months or so.
In this blog, I’ll focus on 6 key economic indicators that the National Bureau of Economic Research (NBER) uses to decide whether the economy is (or was) in a recession. To make that call, they look for broad-based decline across the labor market, incomes, consumption, industry, and sales. These include
- Employment: both using the nonfarm payroll version (which is where the monthly jobs number comes from) and the household survey version (where the unemployment rate comes from)
- Real personal consumption expenditures, which is basically spending adjusted for prices
- Real personal income excluding transfers (payments from the government to individuals for which no services are received, like social security, medicare, etc), which is income adjusted for prices
- Industrial production, which is a measure of the real amount of production in the economy
- Real wholesale and retail sales, which are sales of goods adjusted for prices
The above are all examples of hard data and the good news is that most of them are tracking higher than pre-pandemic levels. The graphic below shows the rate of growth of these six indicators since the beginning of the year and over the prior three months, compared to the pre-pandemic average. The growth rates are all annualized so that we can compare apples-to-apples.
As you will see below, employment and industrial production are increasing faster than we saw before the pandemic. There’s been a slowdown over the past 3 months (with the yellow bar shorter than the light blue line), but growth is still strong. It was always going to be hard to sustain employment growth at 500,000+ per month, so a slowdown is only to be expected.
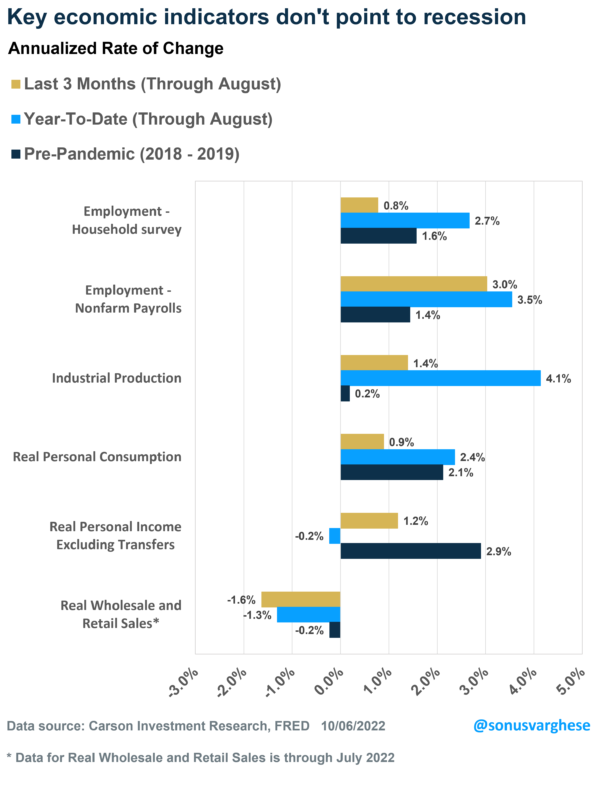
But let’s take the three that are growing at a pace slower than what we saw pre-pandemic: consumption, incomes, and wholesale/retail sales.
Consumption – it’s all about the switch
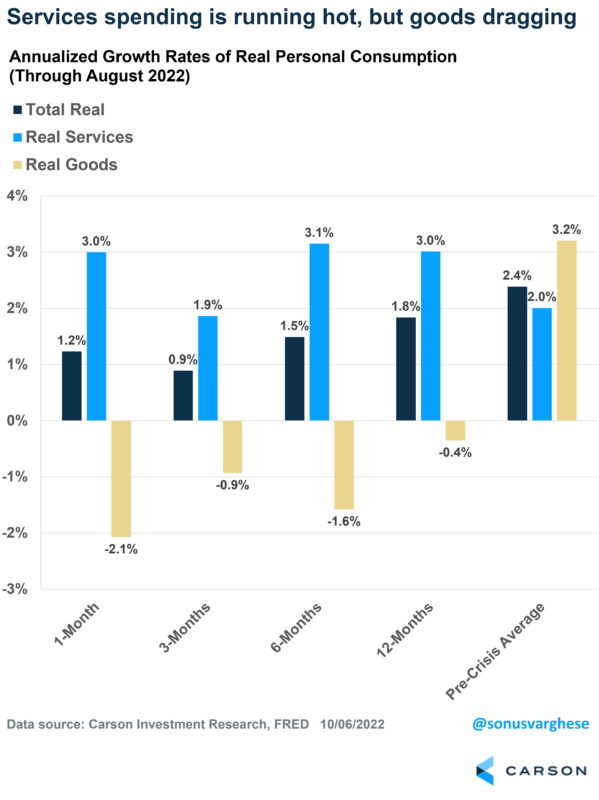
As the chart below illustrates, spending on services is running at a pace that is well above pre-pandemic rates. Even over the past 6 months, services consumption is running at a 3% annualized rate, well above the 2% pace we saw pre-pandemic.
The slowdown in consumption is because of the drag from goods spending (the yellow bars in the chart). Of course, this is not entirely bad because a lot of inflation we’ve seen over the past year is because demand for goods has outpaced supply, sending prices higher.
Inflation erodes income gains
The slowdown in real incomes is about higher prices eroding wage gains. And as we saw above, consumption has remained fairly strong – which means consumers have been dipping into the massive well of excess savings that were amassed amid the pandemic. The good news is that the pot of excess savings hasn’t completely been drained yet.
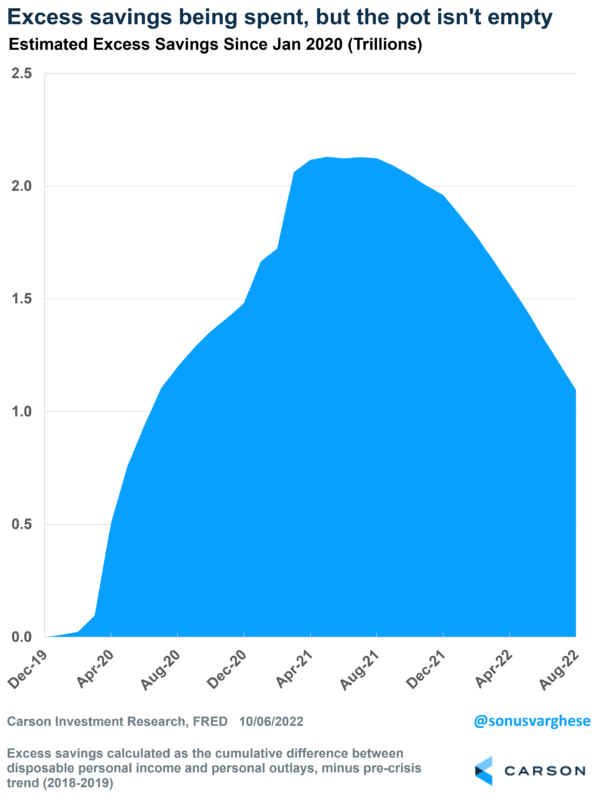
Also, inflation appears to have peaked, with consumers getting a break on energy prices recently. Combine that with the fact that overall employee compensation has returned to the pre-crisis trend, and it looks like real income growth could pick up from here.

We’re already seeing real incomes rebound as inflation eased. Going back to the first chart, real incomes fell at an annualized pace of 0.2% over the first 8 months of the year. But they’ve increased at a 1.2% annualized pace over the past three months, indicating positive momentum.
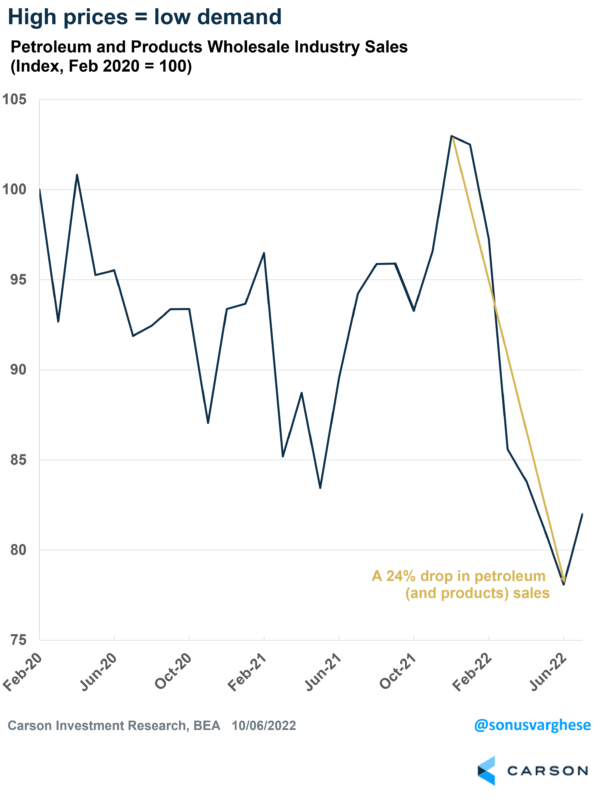
Wholesale and retail sales impacted by falling gasoline sales
When prices go up you expect demand to fall. And that’s pretty much what’s happened with wholesale gasoline sales (after adjusting for prices) falling 24% since the beginning of the year. Again, no surprise but what’s really behind the fall in wholesale and retail sales?
Overall, the economic picture looks positive, for now. The other side of this is that a strong economy means there’s strong demand and that means the Fed’s not going to be easing up any time soon. The Fed’s already aggressively raised rates over the past 10 months, and it’s going to take a while to see the impact of that on the economy. For now, it doesn’t look like the economy is rolling over, but it’s something to watch for.