We have only four weeks to go to election day, although close to 2 million people have already voted, including close to half a million in states like Pennsylvania, Wisconsin, and Michigan. We figured this would be a good time to do an update on where the race stands, and what it means (or could mean) for the economy and markets as we move beyond the election. But first, let’s level set as to where we are.
2024 has already been an exceptional year, with the S&P 500 up 22% over the first nine months of the year. As Carson’s Chief Market Strategist Ryan Detrick pointed out, that is the best we’ve seen in any presidential election year since 1950. Perhaps it shouldn’t be entirely surprising given corporate profits are rising amid a solid economic backdrop. Employment is in a reasonable place, with recent data showing signs of stabilization. Real GDP growth was revised higher recently and is up 3% over the last year (as of Q2). Q3 GDP growth looks set to come in strong as well. As I wrote in my recent blog discussing September payrolls, income growth is powering the economy, as opposed to credit. Inflation has also come off the boil, with lower oil prices helping. That’s allowed the Fed to start cutting rates, an added tailwind for the economy and markets.

Stay on Top of Market Trends
The Carson Investment Research newsletter offers up-to-date market news, analysis and insights. Subscribe today!
"*" indicates required fields
A note on the data: I mostly use Nate Silver’s (Founder of FiveThirtyEight) data in this blog because he has the longest (successful) election forecasting model, which included putting much higher probability on a Trump win in 2016 (29%) than other forecasters, and even prediction markets. A couple of others also have a good methodology but they are more recent, including Split Ticket and FiveThirtyEight (previously the Economist model). I’m setting aside the prediction markets and betting sites for two reasons. One, a good forecasting model has historically done better than prediction markets, on average. Two, for popular major events (including the Super Bowl), there’s so much recreational money and not enough “sharp money” to take it all off the table. The more “knowledgeable” bettors don’t dominate the pool, which means the information content from these betting pools are less predictive, more sentiment driven, and overresponsive to short-term news flow.
The Presidential Race – Looks Stable
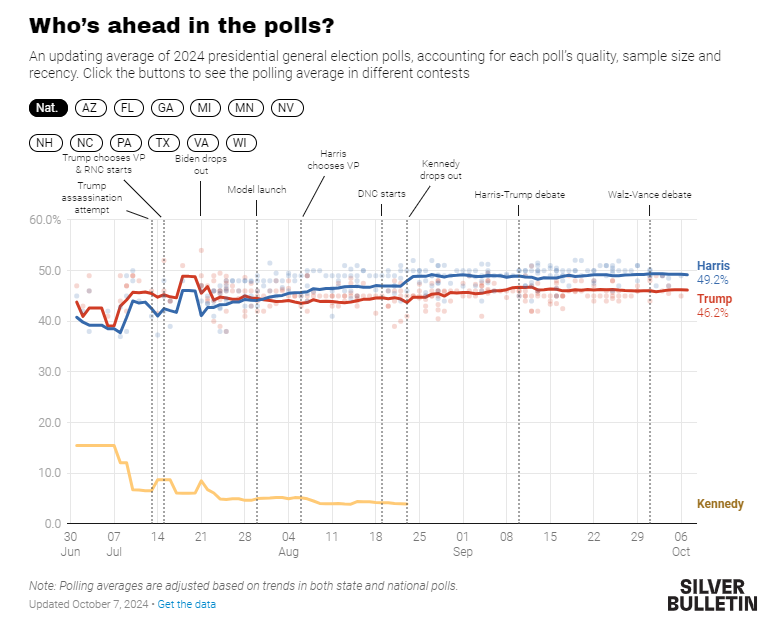
There was a lot of volatility in the presidential race back in June (after the Biden/Trump debate) and then in July (when Biden stepped down). But since then, the race can be characterized by one word: stability. At least on the face of it. None of these major events really moved the numbers: the Democratic National Convention, third-party candidate Robert F. Kennedy dropping out and endorsing former President Trump, a presidential debate, and a vice-presidential debate. Vice President Harris has held a narrow but fairly steady lead against Trump in the polls, mostly ranging between 2.5-3%. Note this is less than Biden’s polling lead in 2020 (+9.8%) or Clinton in 2016 (5.0%) on October 8 according to Nate Silver’s polling average.
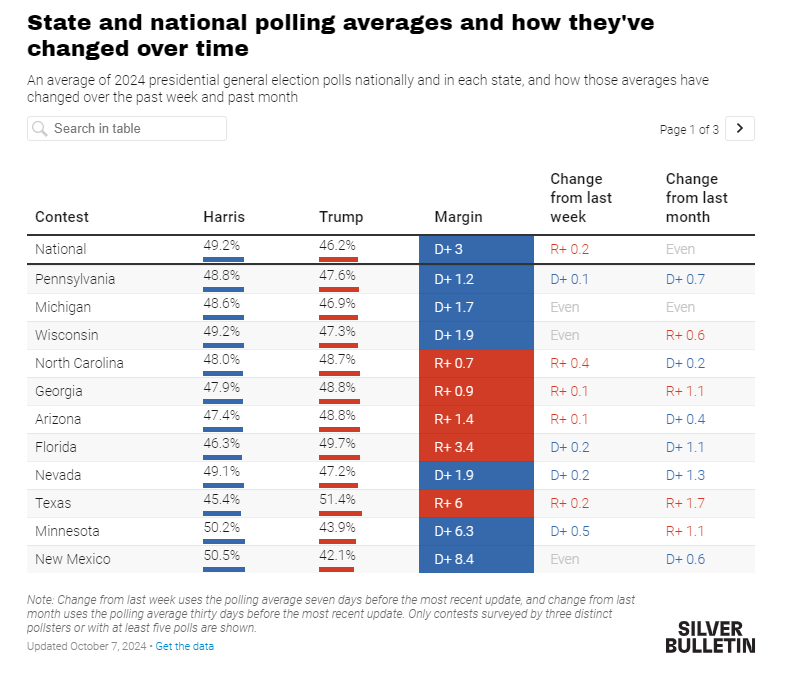
Despite Harris’s narrow but steady lead, the race is still a toss-up, with only a very slight edge to Harris. That’s because of the electoral college “bias” towards Republicans. The bias exists because Democrats typically run up the score in populous areas like New York and California. But key swing states like Pennsylvania, Wisconsin, Michigan, Nevada, North Carolina, Nevada, Arizona, Georgia are all polling within 1-2 points. Harris has a slight lead in the polls in the first 4 states, which would be enough to take her to victory.
However, a normal-sized polling error could result in one of the following:
- A Harris landslide (if we see an error similar to 2022 polls)
- A Trump win exceeding his narrow 2016 margins (if we see an error similar to 2020 polls)
Both are within very reasonable bounds of possibility. All three forecasting sites I referenced account for correlated errors (but in different ways). That means the “stability” of the race in the polls hides enormous uncertainty in the outcome. A shift in one direction in one state implies a somewhat parallel shift in many other states. That is why Harris has somewhere around a 55% chance of win (as of October 7), i.e. not far from a toss-up.
- Silver Bulletin: 55% Harris – 45% Trump
- Split Ticket: 57% Harris – 43% Trump
- FiveThirtyEight: 55% Harris – 45% Trump
A key point is that the above numbers DO NOT represent vote share (I see people making this error online all the time). A 55%-45% probability is not too far from 50-50 (pretty much the same, for all practical purposes).
At the same time, Harris is much more widely favored to win the popular vote, with Silver Bulletin putting the odds above 75% (I’ll come back to the relevance of this).
The Senate – Republicans Favored
Democrats currently have a majority in the Senate of 51-49. That means they can only afford to lose one seat and maintain a majority, assuming Harris wins the Presidency (the sitting VP gets the tie-breaking vote). Democrats are almost assured of losing Senator Manchin’s seat in West Virginia. Which means if they lose one more seat, Republicans take the Senate irrespective of who wins the White House. (It also means if Trump takes the White House, a Republican Senate majority is extremely likely.)
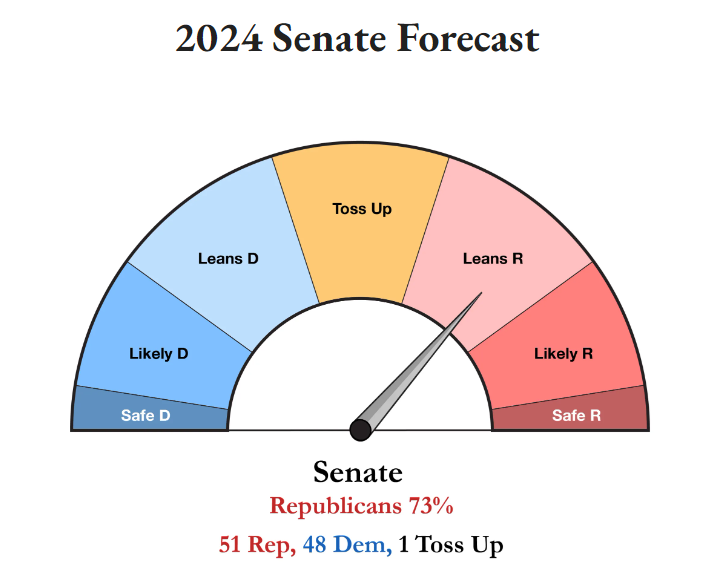
Right now, Montana is increasingly favored to go for Republicans, with Split Ticket putting an 82% probability of a Republican win. Democrats are almost as likely at this point to flip Nebraska, Texas, or Florida, so there’s a chance Democrats lose Montana and hold the Senate, but only on an extremely good day. Ohio is also looking very tight, with odds of 51-49 in favor of Democrats. As a result, Split Ticket currently has a 73% probability on Republicans taking the Senate, i.e. leaning Republican.
Taken from: https://split-ticket.org/senate-2024-ratings/
The House – Democrats Hold a Slight Edge
As I noted above, Harris is well favored to win the popular vote. That by itself means Democrats ought to have an edge in the House. Running up the score (or votes) in New York and California is not going to help Harris much, but it helps House Democrats. The fight for the House will likely be decided in these two states. Democrats currently lead in the “generic ballot” against Republicans, based on national polls that look at preference for a Republican or Democrat in Congress with no reference to a specific race. But the generic ballot lead is (you guessed it) narrow, with Democrats leading by just under 2%-points. This is why Split Ticket puts a probability of 56% in favor of Democrats taking the House. That’s only a very slight edge in favor of Democrats.
Split Party Control?
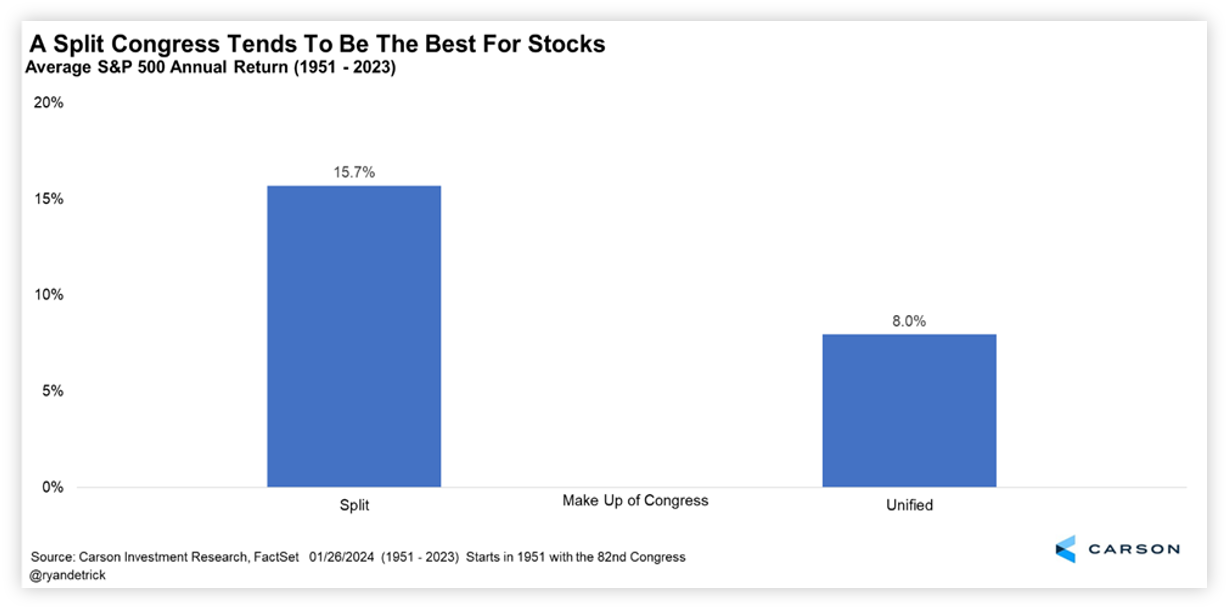
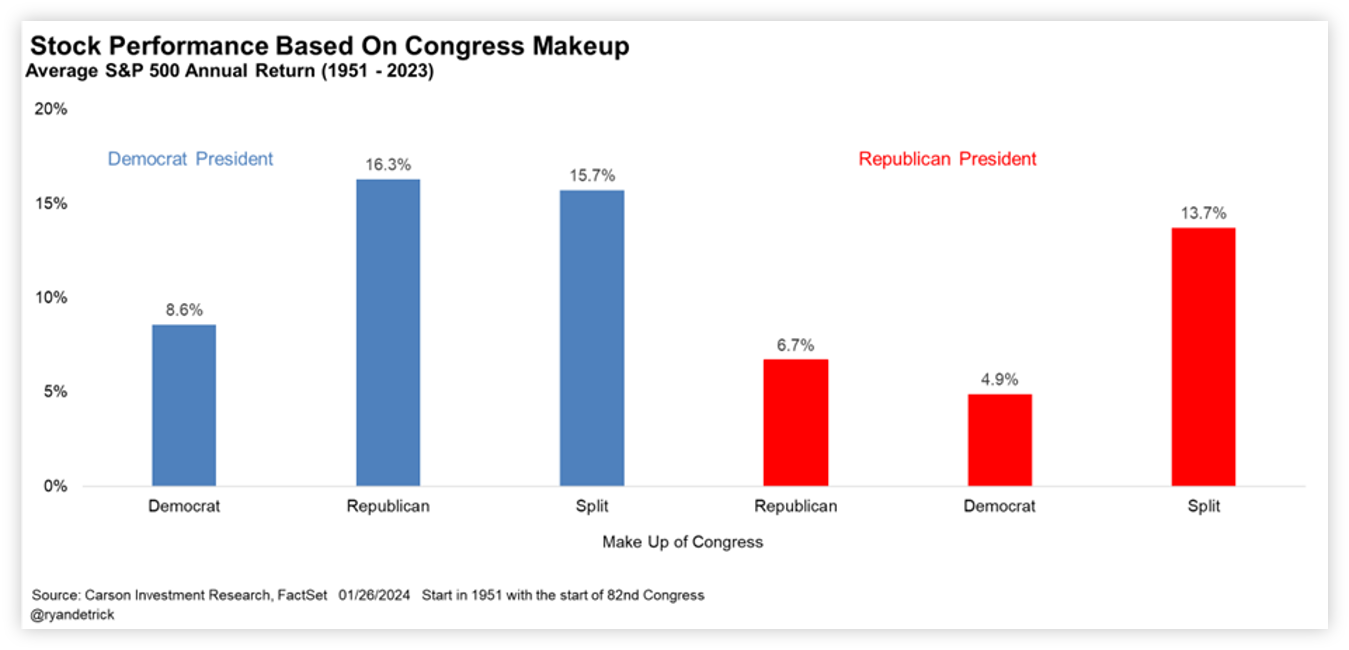
Based on current polls, and forecasts based on those polls, we could very well be looking at split party control of DC in 2025. That’s not a bad thing — especially if it means we’re unlikely to get big swings in policy, since presidents can’t “go big” with divided control. And that ought to be comforting for investors. As much focus as is on the Presidential race, control of Congress matters just as much. Here’s a nice chart from Ryan showing that a split Congress (House and Senate led by different parties) tends to be best for stocks, with average annual returns of 15.7%. Versus 8% when you have unified control.
Blue or red waves aren’t great for investors. Years with a Democratic President and Republican/split Congress and Republican President with a split Congress tend to be better for stocks.
Right now, it looks like odds favor split party control of Congress and the White House next year. That’s historically been positive for markets as you saw. Of course, it doesn’t mean a “blue wave” (Democrats sweep all three branches) or a “red wave” (Republicans sweep) is unlikely. The odds of either of these are not insignificant. Keep in mind that a sweep with a narrowly divided Congress acts a little like a split Congress, since each party’s most centrist members have a lot of influence.
Control of Congress is especially important this time around. That’s because we have a massive fiscal event, or cliff, at the end of next year. If Congress does nothing, a lot of elements of the Tax Cut and Jobs Act of 2017 (signed into law by former President Trump) expire on December 31, 2025. Most expiring provisions are on the individual side, but there’s some risk to corporate taxes as well. Keep in mind that 2026 is a midterm election year, and so it’s unlikely Congress will want to go into it having just raised taxes on households. In any case, Washington DC in 2025 is likely to dominated by tax policy related negotiations, getting ever more feverish as the deadline approaches.
In part 2 of this blog, I’ll discuss the main risks associated with a blue or red wave, and the potential big picture impact of tax policy on the economy and markets. Stay tuned.
For more content by Sonu Varghese, VP, Global Macro Strategist click here.
02447017-1001-A


