We are now three weeks to election day, though about 4.7 million people have already voted. Most of those are mail-in ballot. About 55 million mail ballots have been requested (that’s 35% of the total votes cast in 2020), and 3.8 million have been returned so far.
In part 1 of this election update, I walked through where the odds stand for the presidential election, the Senate, and House. That was from a week ago, and things really haven’t changed much. It’s a very close race for the presidency, at least going by polls. In some ways, the US is bucking a global trend. Incumbents across the world who governed through the inflationary aftermath of the pandemic have taken bit of thumping at the polling booth, including in Britain, France, South Korea, Brazil, India, and even South Africa. The counter here in the US is that the economy has outperformed other developed economies and even pre-pandemic projections. At the same time, there’s a lot of uncertainty in the polls. Even a narrow polling error could see Vice President Harris win in a landslide, or former President Trump winning with a margin that exceeds his narrow victory in 2016.
Control of Congress is especially important this time around. That’s because we have a massive fiscal event, or cliff, at the end of next year. If Congress does nothing, a lot of elements of the 2017 Tax Cut and Jobs Act (TCJA, which was signed into law by former President Trump) will expire on December 31, 2025. Most expiring provisions are on the individual side, but there’s some risk on the business side as well. Washington DC in 2025 is likely to be dominated by tax policy related negotiations, which will get ever more feverish as the deadline approaches.
What Could Upset the Apple Cart? Higher Taxes and Tariffs
To be clear, by “apple cart,” I mean the stock market and the economy (and both are looking pretty good).
Right now, the race for the House is tight, while Republicans are favored in the Senate. Odds slightly favor split party control of Washington D.C. next year, a situation that has historically been positive for markets (Presidents can’t “go big” on policy changes in one direction or the other). However, the odds of a Blue Wave or a Red Wave are not insignificant. So, it’s worth looking at the biggest risks associated with either a Blue or a Red wave.
Blue wave: The main risk of a Democratic sweep is higher corporate taxes. Harris’ plans include raising the corporate tax rate from 21% to 28%. That would not be as high as it was pre-2017 (35%), but it would still be a drag for equities. However, even if we have a 2022-sized polling error in favor of Democrats, the Senate will likely be close. There’s likely to be at least 1-2 centrist-leaning senators within the Democratic party who are unlikely to agree to a corporate tax hike, so I think the odds of a corporate tax hike even with a blue wave are quite low.
Red wave: The main risk of a Republican sweep is around tariffs. Tariff policy does not necessarily involve Congress. Presidents can impose tariffs without bringing Congress into the matter, as former President Trump did in his first term. This matters because President Trump has ratcheted up the rhetoric on tariffs. He recently said he’d impose a 200% tariff on vehicles imported from Mexico (which would drive up prices immediately). He could be emboldened by a red wave, taking it as tacit approval for his tariff proposals. By itself, this would not be a great scenario for markets. Looking back, the trade war of 2018-2019 created a lot of volatility. The S&P 500 eventually recovered from a 4% drop in 2018, mostly thanks to the Fed pulling back rates in 2019. However, if inflation surges because of tariffs, the Fed may put interest rate normalization on hold, creating an additional headwind for the economy and markets.
Investment spending, which is what you need for productivity growth, also lagged across 2018-2019, reversing gains made initially in anticipation of corporate tax cuts. The chart below shows new orders for nondefense capital goods (a proxy for business investment) from 2017 through February 2020 (pre-pandemic). The TCJA was strong supply-side policy implementation that encouraged investment, but its impact was considerably dulled by the Trump administration’s trade policy.
Deficit Spending, as Far as the Eye Can See
Both Harris and Trump have put out various tax proposals. We can’t really know what will be implemented. In addition to not knowing who will be in the White House and the make-up of Congress, we don’t know how much of this is just campaign rhetoric. But the big picture is this: deficits are likely to increase.
We think Congress is unlikely to simply do nothing and let all tax cuts expire. This “fiscal cliff” is certainly a risk, especially if we get split party control and the different sides can’t reach a deal, but both sides would likely consider such an approach an unforced policy error, not to mention a midterm election error. Think of what higher taxes across the board will do to household spending in early 2026. However, this is highly unlikely, especially with upcoming midterm elections in 2026 clarifying the sense of purpose (and ambitions) in Congress.
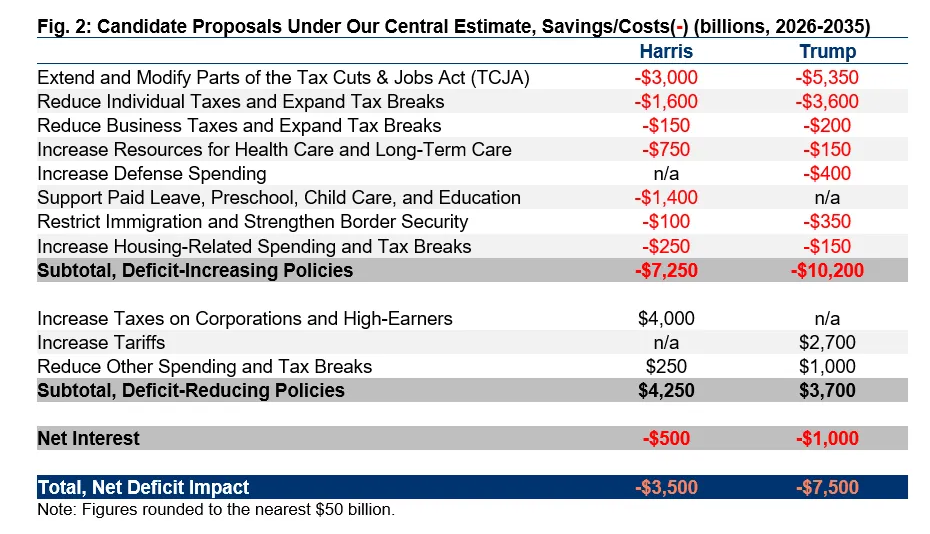
By itself, extending every single expiring provision of the TCJA will increase the federal budget deficit by $5.2 trillion over the next 10 years (2026-2035). With that baseline, let’s look at the impact of the two candidate’s plans, as analyzed by the bipartisan Committee for a Responsible Federal Budget (CRFB).
Harris’ plans would add about $3.5 trillion to the deficit, with estimates of $0 at the low end, and $8.1 trillion at the high end. Trumps’ plans would add $7.5 trillion to the deficit, with $1.5 trillion at the low end, and $15.2 trillion at the high end. The table below is from the CRFB and shows the median estimates for both candidates. None of it is likely to come to pass exactly as you see below, but these will form the outlines of any negotiation. And irrespective of who’s President, or who controls Congress, the path of least resistance is more spending, and higher deficits (I wrote about this way back in March).
Taken from: https://www.crfb.org/papers/fiscal-impact-harris-and-trump-campaign-plans
Rising Deficits During Economic Expansions Is Rare
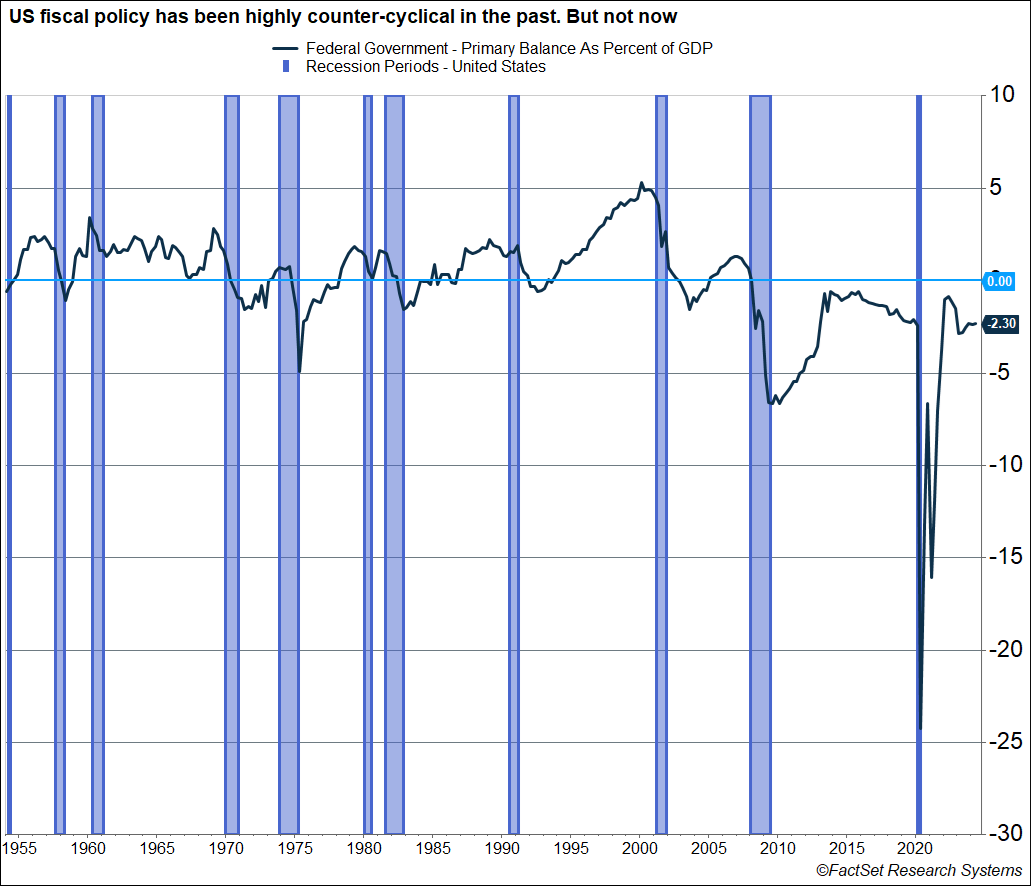
The Federal government’s “primary balance” is revenue minus spending excluding interest payments on Treasury debt. It is one way to measure how much net spending is happening at the Federal level. The chart below shows the primary balance as a percent of GDP. As you can see, prior to the 2010s, the primary balance was always in positive territory as economic expansions wore on. It fell into deficit only during recessions, which isn’t surprising. That’s when economic stabilizers (like unemployment benefits) kick in. Revenue collection also drops during recessions, as there’s less income. In short, US fiscal policy has historically been counter-cyclical. The exception to this was the mid-to-late 2010s, when deficits rose even as the economy strengthened (especially after the TCJA was passed). But this new dynamic is likely to continue into the rest of this decade.
Markets May Like Deficit Spending, At Least Temporarily
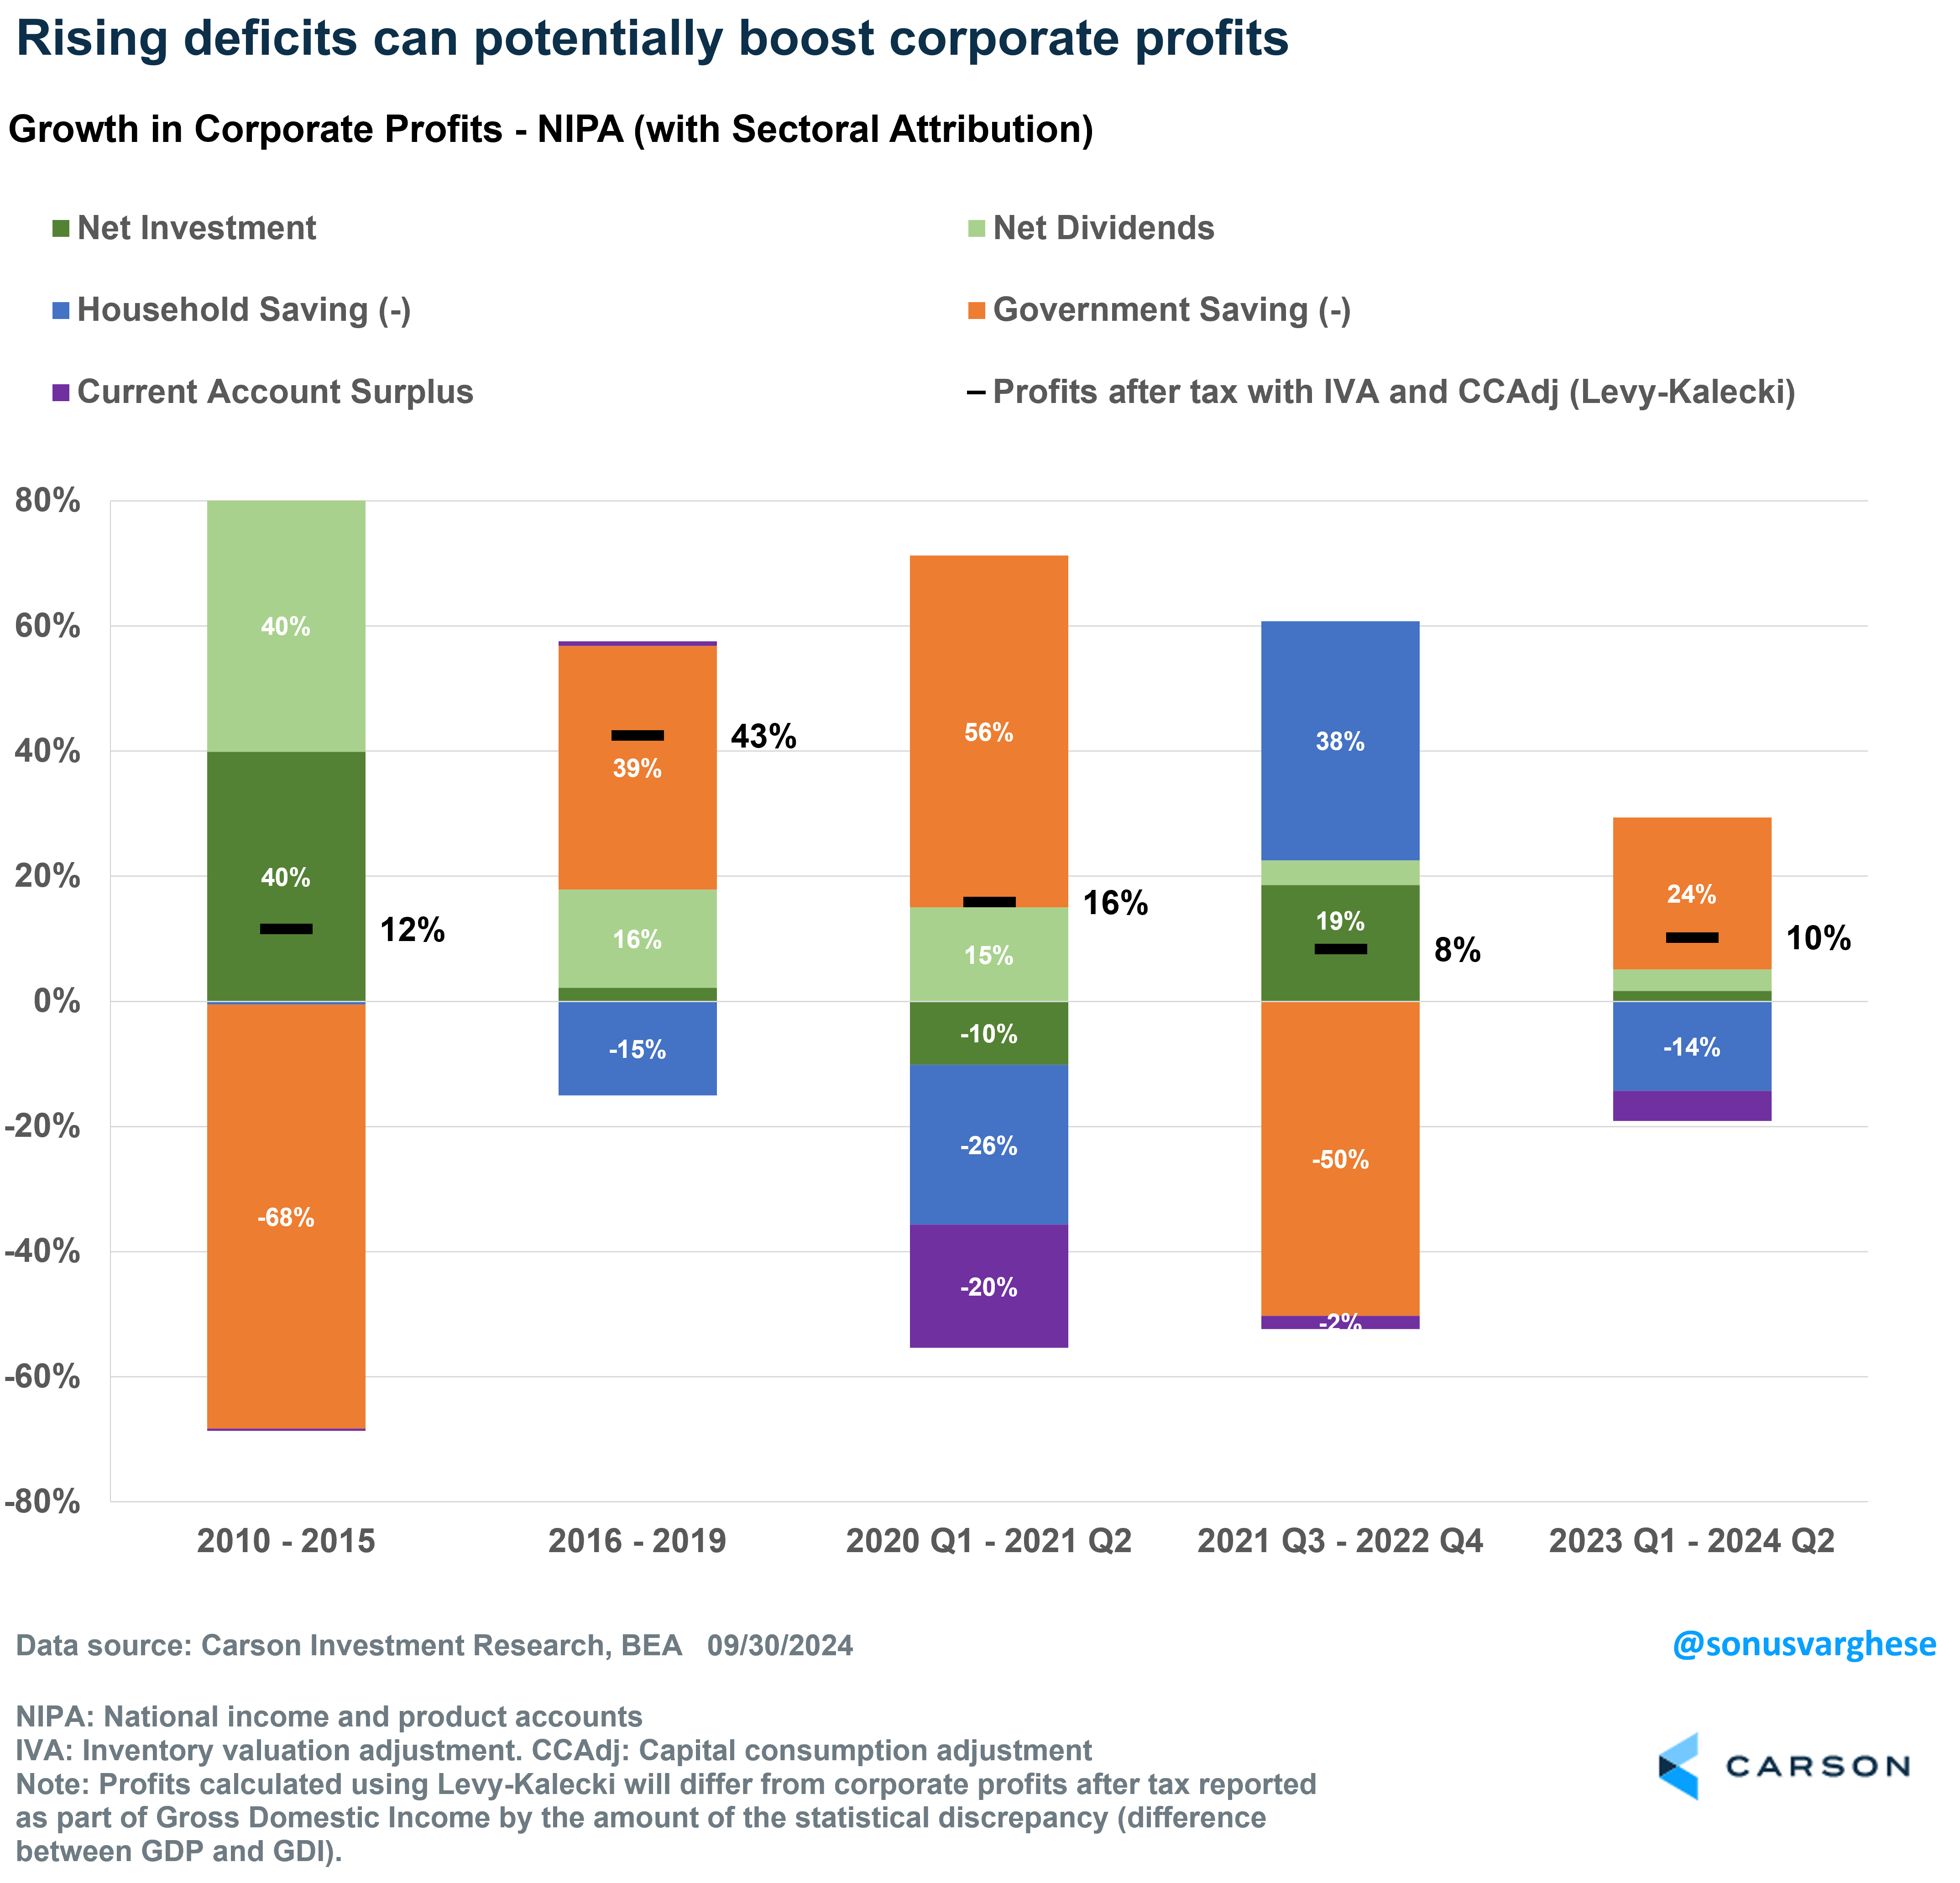
Deficits can potentially boost corporate profits, assuming it doesn’t crowd out consumer spending or private sector investment — we wrote about this in our 2024 midyear outlook. That’s positive for markets, since profits are what matter. At the national aggregate level, corporate profits are the net result of saving and consumption by the four major sectors of the economy: households, businesses, government, and the rest of the world (via trade). Rising household savings and rising government savings (budget surpluses) drag from profits, and vice versa. More business investment and dividends paid out add to profits. A rising current account surplus means the rest of the world is buying more US-made goods and services than Americans buy from foreigners, and that increases business revenues and profits, whereas a current account deficit (which is typically what the US has) means Americans buy relatively more from abroad, and that’s a drag on profits. Note that this aggregate picture doesn’t tell us which companies are growing profits, or how it’s distributed across industries.
Profit growth surged over the 2016-2019 period on the back of higher fiscal deficits (post-TCJA). Even over the last six quarters, households have started saving more (relatively) but corporate profits rose because fiscal deficits started growing again.
All this to say, the risks of a higher corporate tax rate (Harris) or tariffs (Trump) could be countered by rising fiscal deficits, resulting in a net boost to profits. That’s potentially positive for markets.
The main concern with deficit-fueled growth is whether it leads to inflation. It doesn’t have to, like in 2018-2019, or even more recently over the past 18 months, when deficits rose but inflation eased. However, it’s quite likely that a US economy that is growing and near its productive capacity sees bouts of higher inflation as well. That could put a halt to the Fed’s easing cycle, and at worst, reverse it with the Fed raising interest rates once again. (Ironically, deficits worsen as rates rise because of higher interest costs for the government.)
Nothing is binary when it comes to investing, let alone for the economy. I’ve laid out several potential risks for markets and the economy, under either a Harris or Trump administration. That doesn’t mean these risks have a high chance of materializing. The most important thing to keep in mind is that U.S. companies are amongst the most dynamic in the world and can adapt to temporary headwinds, whether higher taxes or tariffs. That’s ultimately positive for long-term profit growth, which is what drives markets for the most part. What we really don’t want to see is a recession, but that’s far from our base case right now.
For more content by Sonu Varghese, VP, Global Macro Strategist click here.
02462210-1001-A


