“Sometimes the questions are complicated and the answers are simple.” -Dr. Seuss
Yes, we’ve remained in the bullish camp for more than two years now and continue to expect 2025 to see stock gains between 12-15%, but that doesn’t mean we don’t have worries. Of course, like everyone else, tariffs are indeed a big worry (with a huge amount of uncertainty), but we’ve spent enough time on those over the past week and today I’ll go over a few other worries that I’m watching closely.
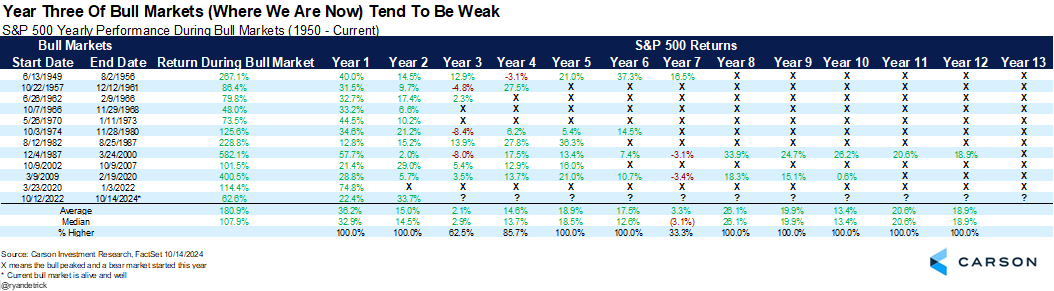
Year Three of a Bull Market
We noted this in 2025 Outlook: Animal Spirits. Stocks usually see huge gains the first two years of a bull market (just like this bull market did) and the third year can be more choppy and frustrating. Although we expect stocks to do much better than the average third year gain of 2.1%, this is still something to consider in 2025 as a potential issue. End of the day, after the huge gains we saw two years off of the October 2022 lows, it would be perfectly normal to see some consolidation at some point in 2025.
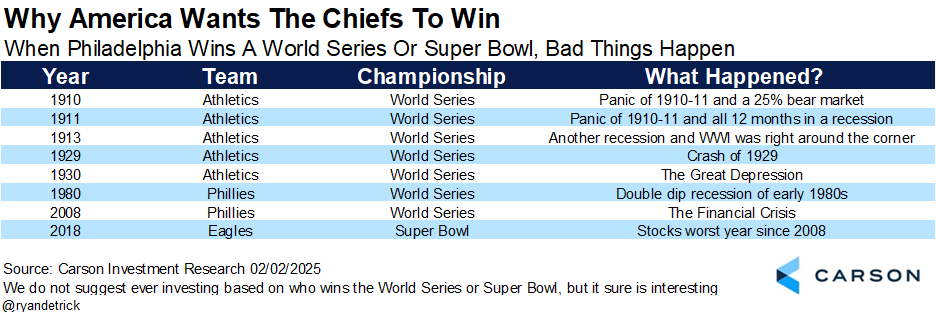
The Philly Curse
This is purely fun, but when a team from the City of Brotherly Love wins a World Series or Super Bowl, very bad things are around the corner.
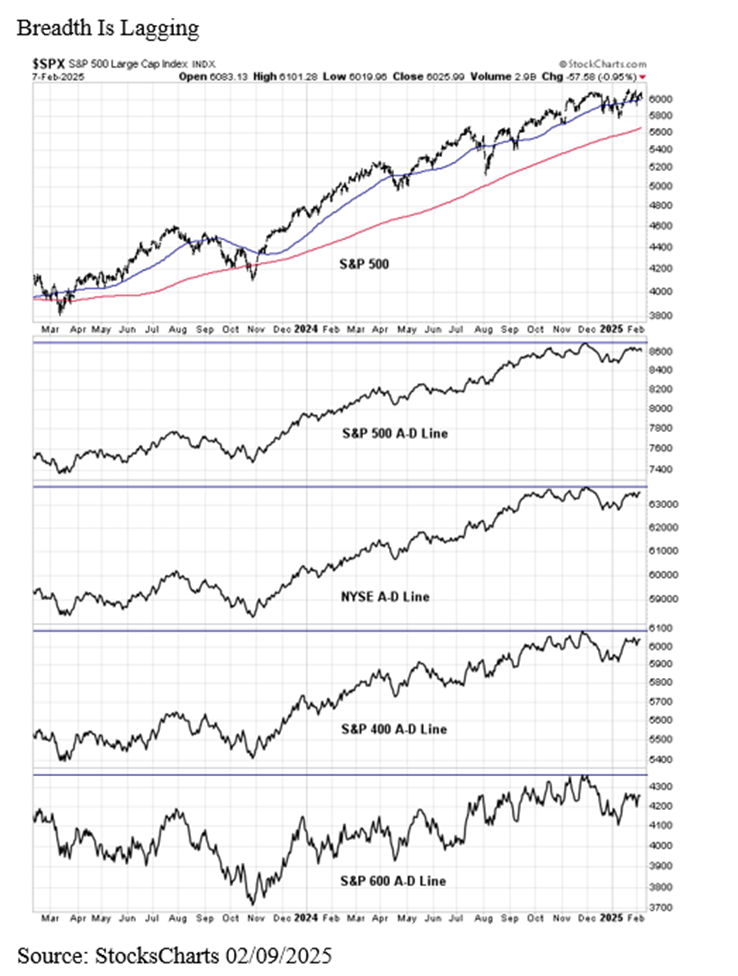
Lagging Advance/Decline Ratios
An advance/decline (A/D) ratio is simply a cumulative tally of how many stocks go up or down each day on a specific exchange. The way I learned it many years ago was breadth leads price. When A/D lines make new highs, it suggests the indexes will likely continue a bullish phase. We saw A/D lines break down well ahead of the tech bubble bursting 25 years ago and again before the Great Financial Crisis, suggesting there indeed was deterioration under the surface.
Yes, we have many stocks doing well this year (even international and emerging markets are joining the party), but one worry I have is various A/D lines have yet to breakout to new highs. There is still time here, but I’d classify this as a yellow flag for the bulls right now. Should these improve and eventually breakout (like I predict), then the bull would be back in a big way. Here’s a nice chart my friend Cam Hui shared recently showing exactly what I mean.
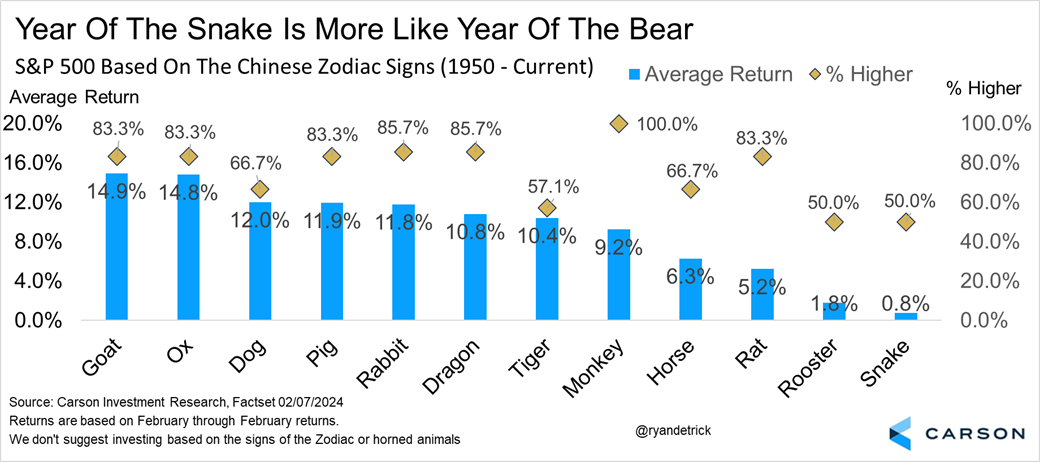
Year of the Snake
Another fun one (and please don’t ever invest based on this) is stocks have done quite poorly in The Year of the Snake, which is exactly the Chinese zodiac sign for 2025. Similar to when Philly wins something, this is totally random, but it is interesting.
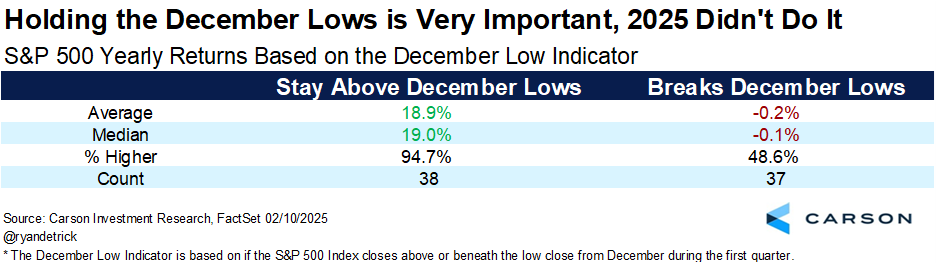
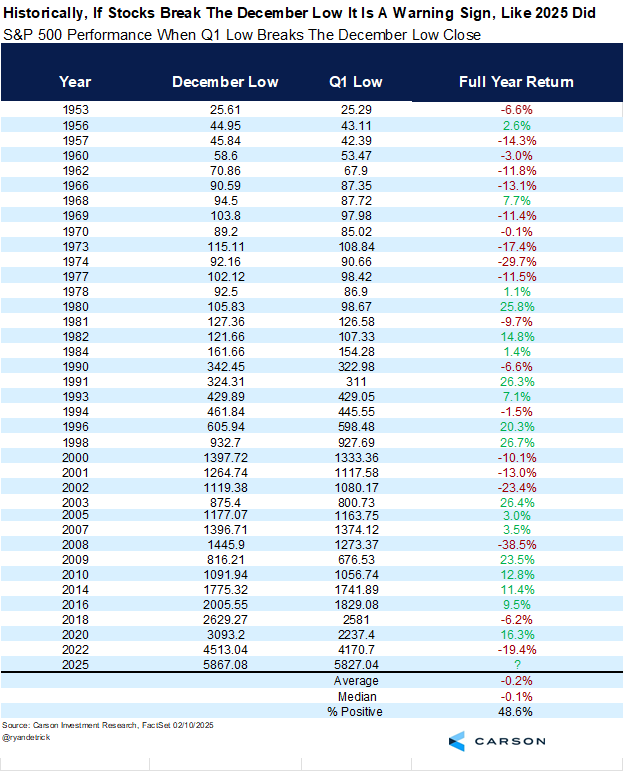
The December Low Indicator
Last and certainly not least, here’s one of my favorite indicators. This is called the December Low Indicator and it is fairly straightforward. When the S&P 500 doesn’t close beneath the December low close in the first quarter, good things have tended to happen the rest of the year. The opposite, of course, is when the December lows are violated in the first quarter. To refresh your memory, the past two years they didn’t break the December low and those were great years, while a break in early 2022 was one subtle clue that the odds were elevated that the rest of the year could be dicey. Well, sorry to be the bearer of bad news, but stocks indeed broke their December low about a month ago.
Stay on Top of Market Trends
The Carson Investment Research newsletter offers up-to-date market news, analysis and insights. Subscribe today!
"*" indicates required fields
Interestingly, since 1950, stocks held above the December lows 38 times while they broke the lows 37 times. Talk about even-steven. Those are some pretty big sample sizes, and sure enough, the takeaway from the historical results are very clear.
Those 38 times the December lows held? The full year was up an incredible 36 times and up an average of 18.9%. The times it failed? The full year was down 0.2% on average and higher less than a coin flip.
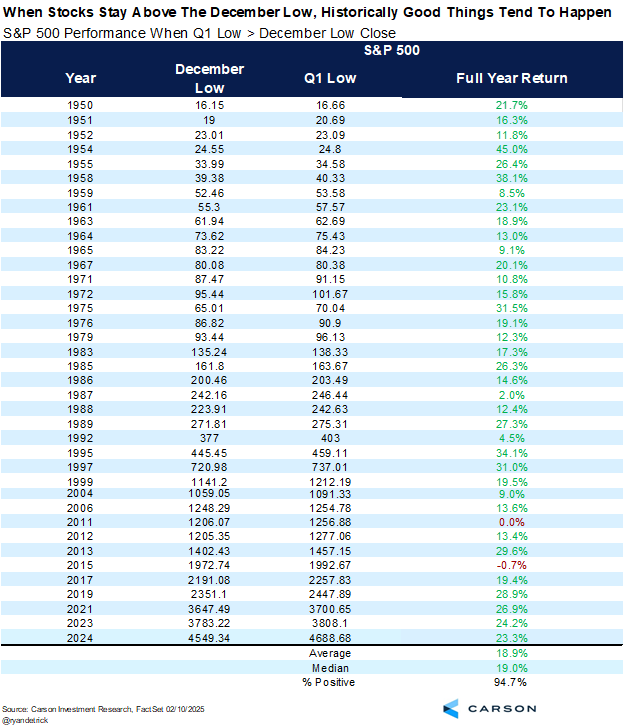
If you want to investigate things more closely, here are all 38 times the S&P 500 held above the December lows. Hard to look at this any other way than in the years this has happened, it was a major clue the bull was alive and well.
Here’s the other side to things and unfortunately where things stand in 2025. What happened when the December low was violated? Once again, the full year returns were plain and simple much weaker. Just a quick glance and some of the worst years ever saw the December lows broken. Years like ’73, ’74, the tech bubble, ’08, and ’22 all made this infamous list. This doesn’t mean 2025 will be like those years. Still, this is one thing that undoubtedly is in my worry column.
So there you have it, some worries I have that have nothing to do with tariffs. I’ll be honest, it was nice not to talk about tariffs for a change. But if you wanted to know more about what we think about tariffs and how they might impact the economy, Fed policy, and your investments, be sure to watch our latest Take Five Video below.
For more content by Ryan Detrick, Chief Market Strategist click here.
7626441-0225-A