There’s been valid concern that employment conditions are deteriorating, ever so slowly. The unemployment rate has increased from a low of 3.4% in April 2023 to 4.3% in July of this year. Hiring also seems to have pulled back a lot, with the Job Openings and Labor Turnover Survey (JOLTS) telling us that the hiring rate (hires as a percent of the labor force) has pulled back to 3.3% — a rate we last saw in 2013 (excluding the peak pandemic months in 2020). I wrote about rising risks a month ago.

Stay on Top of Market Trends
The Carson Investment Research newsletter offers up-to-date market news, analysis and insights. Subscribe today!
"*" indicates required fields
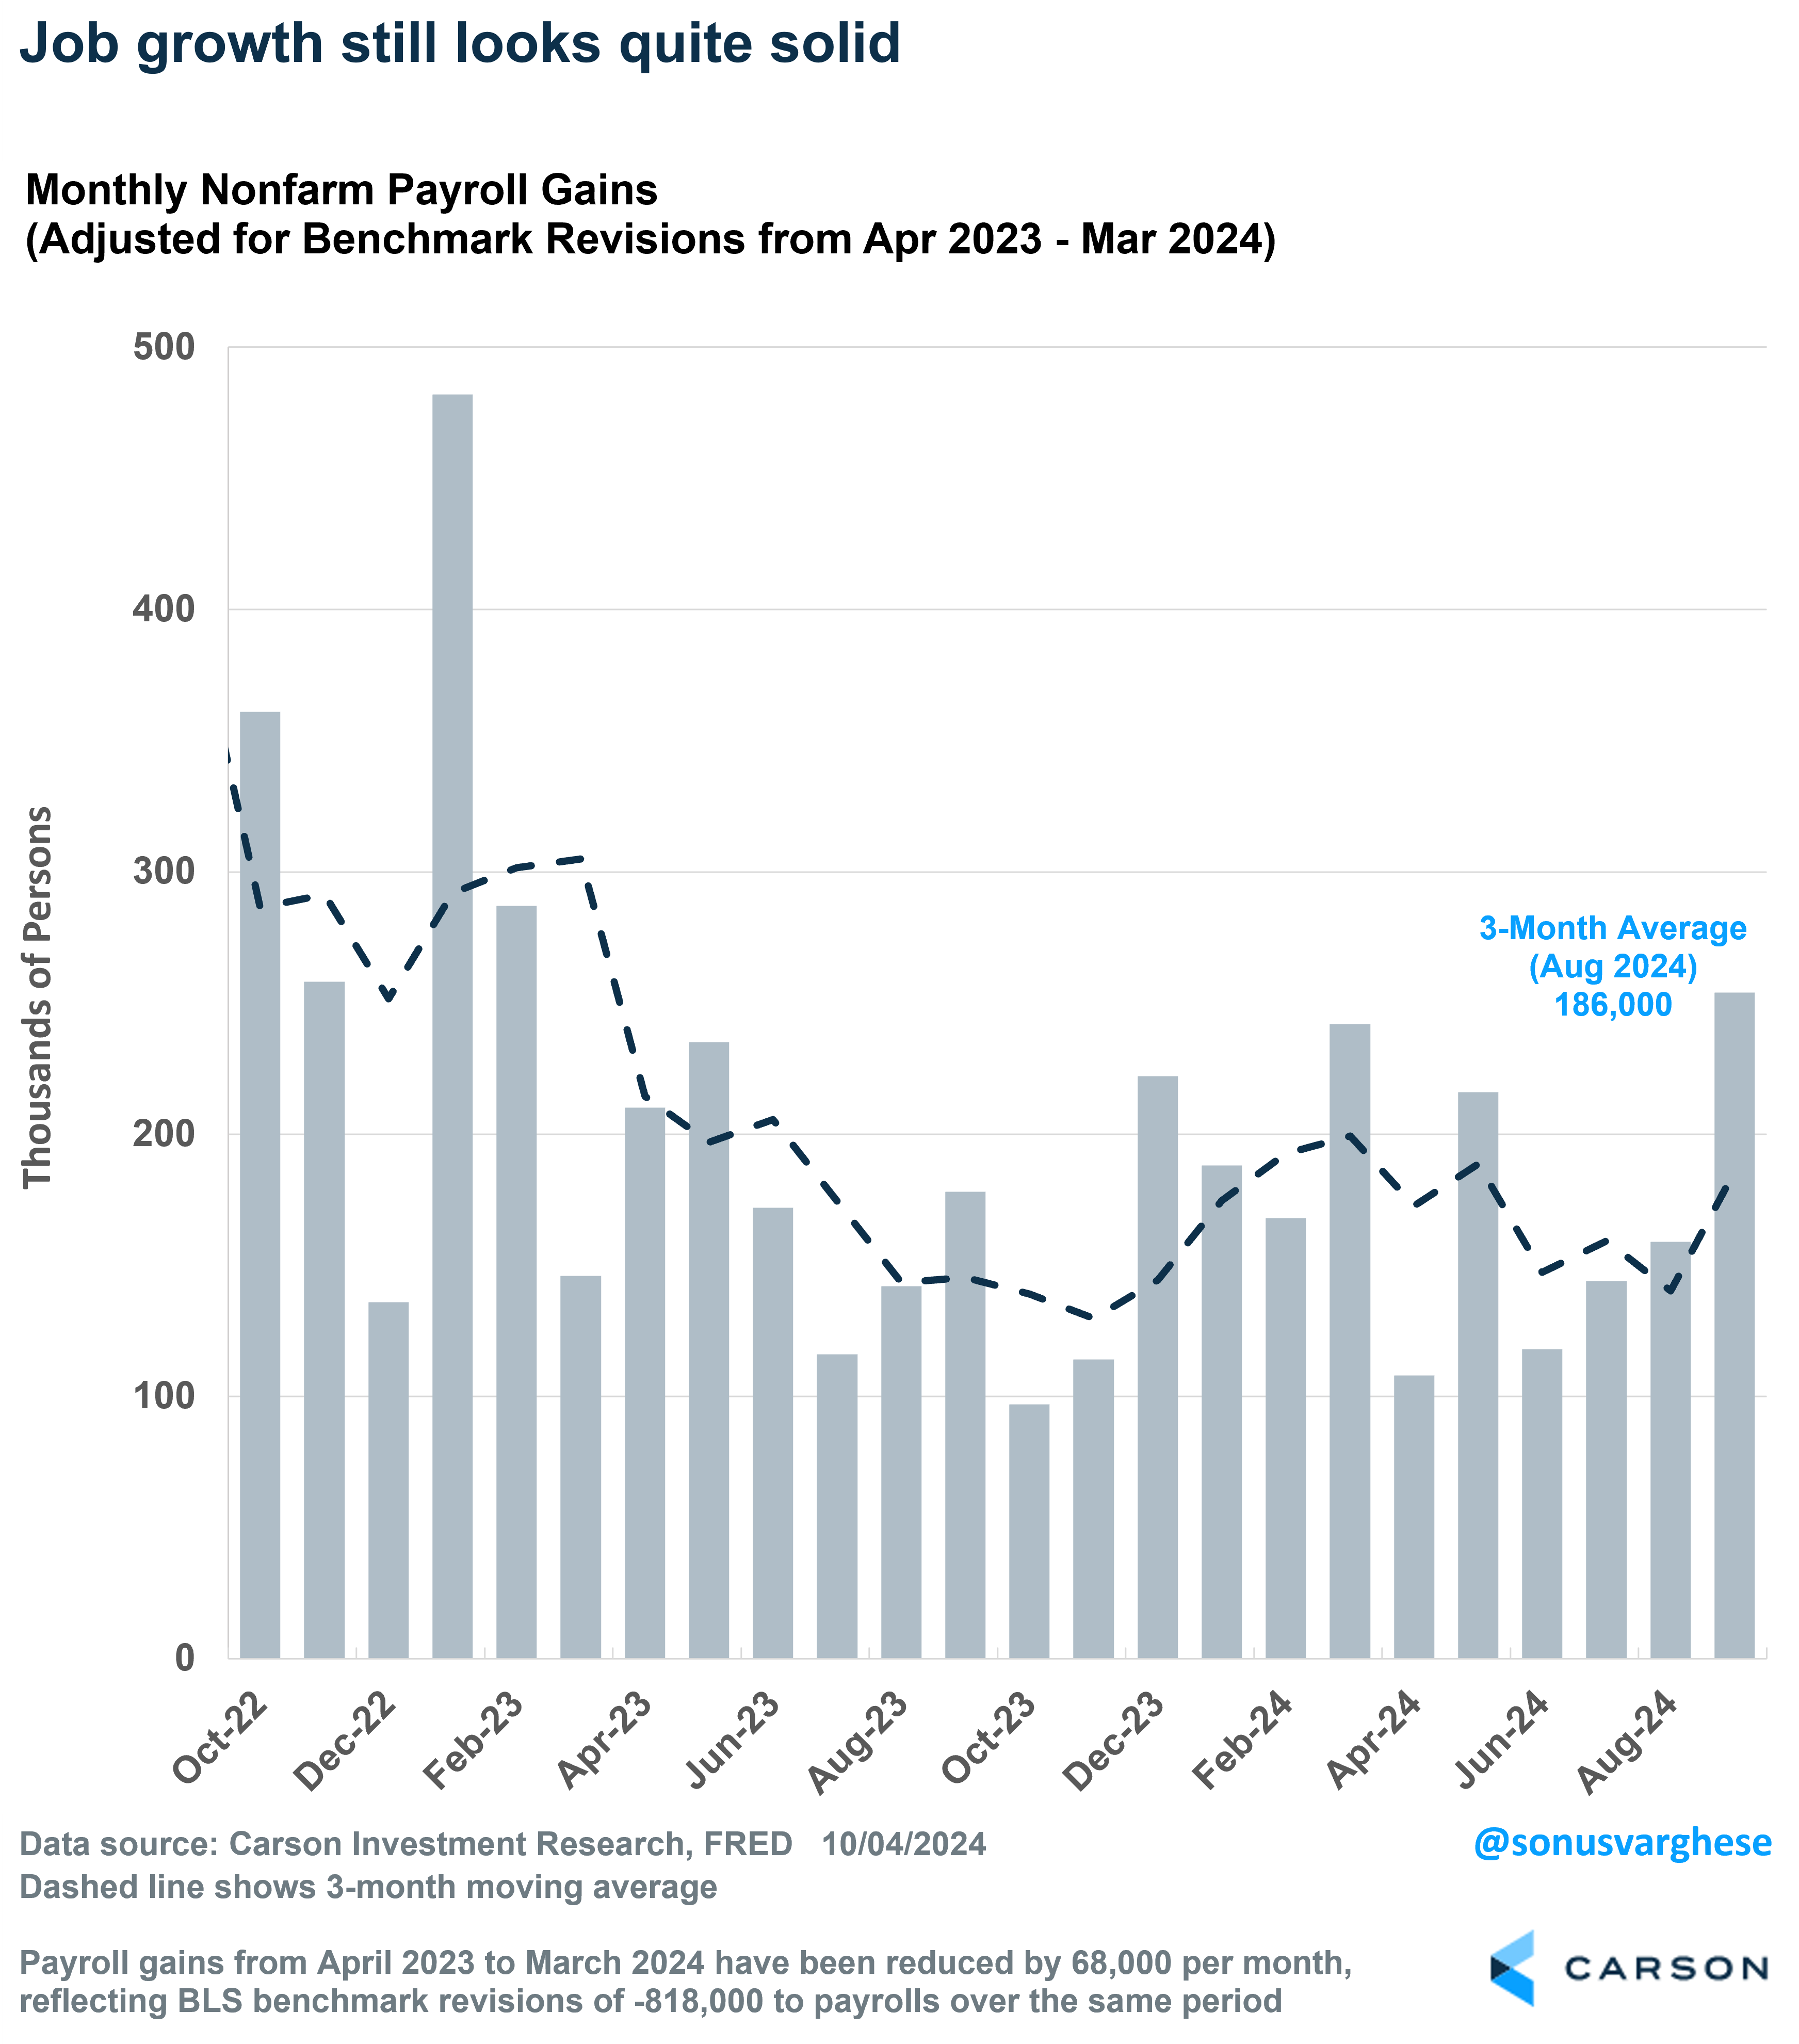
The September payroll report went a long way to ease some of these concerns (which is not to say risks have disappeared). Payrolls grew by 254,000 in September, doubling expectations for a 125,000 increase. Monthly payrolls can be noisy and subject to revisions. The good news is that July and August payrolls were revised higher, taking the 3-month average to a solid 186,000. This report also takes on outsized significance because the next two payroll reports are likely to be impacted by Hurricane Helene, with job growth pulled lower in October and reversing in November. The good news is that the port strike has ended, and so that’ll be a non-factor. In any case, it’s going to be January (when we get December payroll data) before we get another “clean” report.
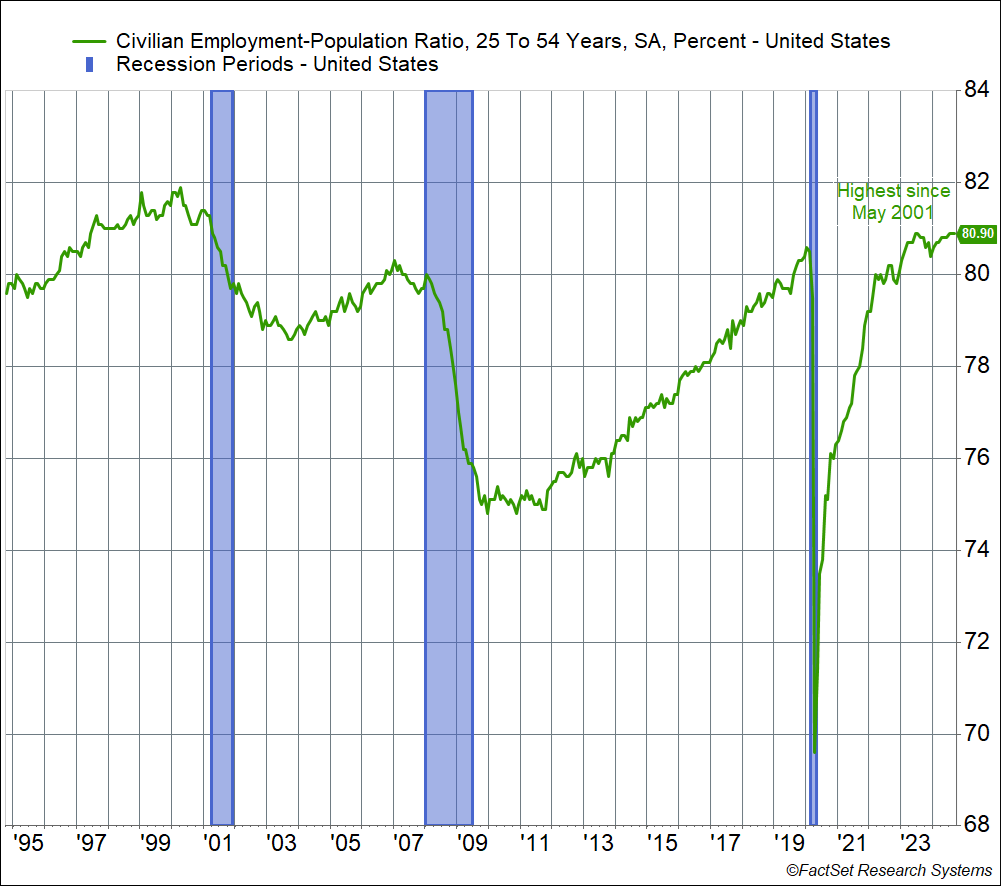
Also very good news was the unemployment rate easing to 4.1%. It was actually 4.051%, just a whisker (or two whiskers?) away from being rounded down to 4.0%. I’ve mentioned in previous blogs how I prefer looking at the “prime-age” (25-54 years) employment-population ratio, since it gets around definitional issues that crop up with the unemployment rate (someone is counted as being “unemployed” only if they’re “actively looking for a job”) or demographics (an aging population with more people retiring and leaving the labor force every day). The prime-age employment population ratio was unchanged at 80.9% in September. That’s higher than anything we saw between 2001 and 2019 (when it peaked at 80.4%).
The fact that the unemployment rate and the prime-age employment population ratio are pointing in the same direction is positive. In our business, it’s about combining a lot of different information, and our life gets easier if the data are mostly telling the same story (good or bad — but fortunately, a good one now).
Income Growth & Productivity Are Driving the Economy
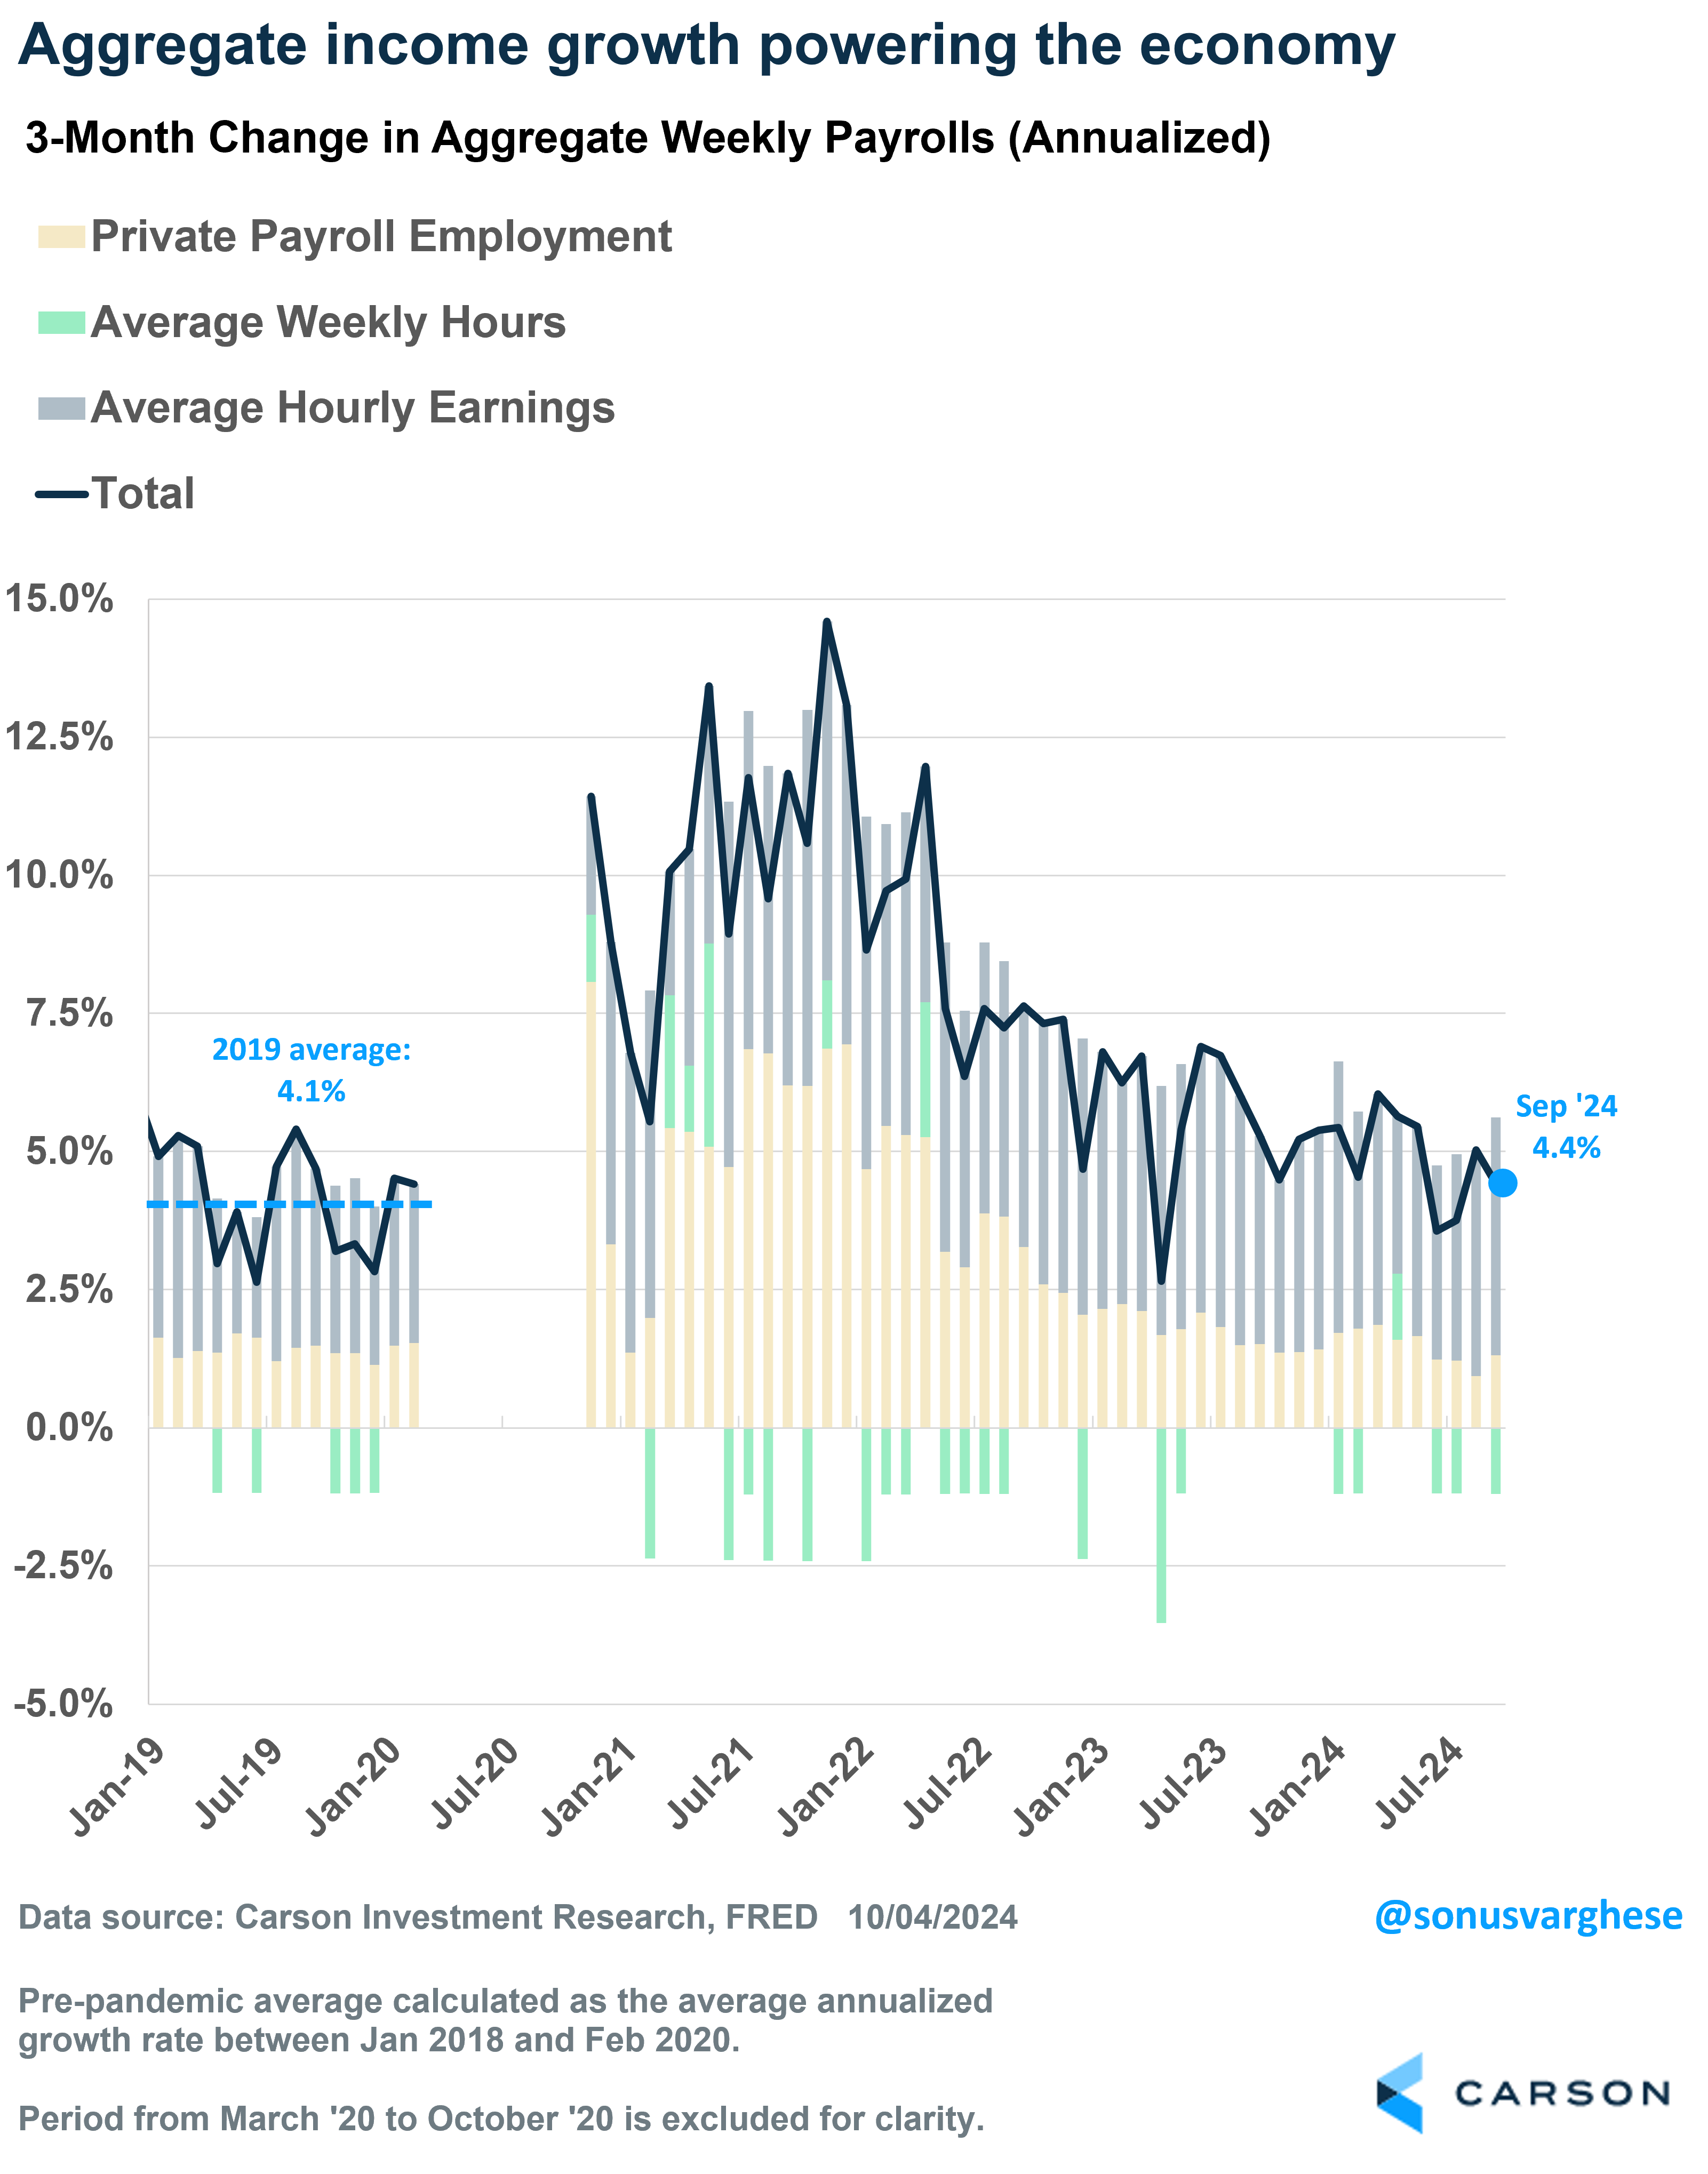
Over the last three months, wage growth has run at an annualized pace of 4.3%, which is solid but shouldn’t raise anyone’s inflation hackles. If you combine wage growth with employment growth and hours worked, we get a sense of aggregate income growth across all workers in the economy. Right now, that’s running at a 3-month annualized pace of 4.4%. If you’re wondering why economic growth keeps exceeding a lot of people’s expectations, especially after recent upward revisions, here’s why: Income growth is powering the economy, as opposed to credit. That is perhaps why this cycle has confounded a lot of people, since we haven’t seen something like this in decades. In fact, consumer credit is up only 1.6% year over year as of the second quarter of 2024, versus 4.6% in 2019, 5.9% in 2006, and 7.8% in 1999. This is also why a lot of people who like to parrot on about M2 money supply have gotten this cycle wrong. M2 is a reflection of credit to the private sector, and that’s simply not growing as it has in prior cycles.
Keep in mind that inflation has likely normalized to around 2% (and would probably be running slightly lower, if not for lagged effects of shelter). Strong wage growth and output growth amid benign inflation implies productivity growth is strong — something we’ve been talking about for a year now, including in our 2024 Outlook. Crucially, that also means the Federal Reserve can continue easing interest rates, and that’s going to be a tailwind for the economy, and markets.
But Can We Believe the Data?
The same people who keep calling for a recession (no surprise, they have a large overlap with M2 watchers) also tend to call the economic data into question. Admittedly, we have seen significant revisions to the data. Employment between April 2023 and March 2024 was revised down by 818,000. The payroll growth chart at the top of this blog does account for this downward revision, and despite that, growth was solid during the revised period. But revisions can go the other way too, as we saw with recent GDP/GDI and savings rate revisions, all significantly positive.
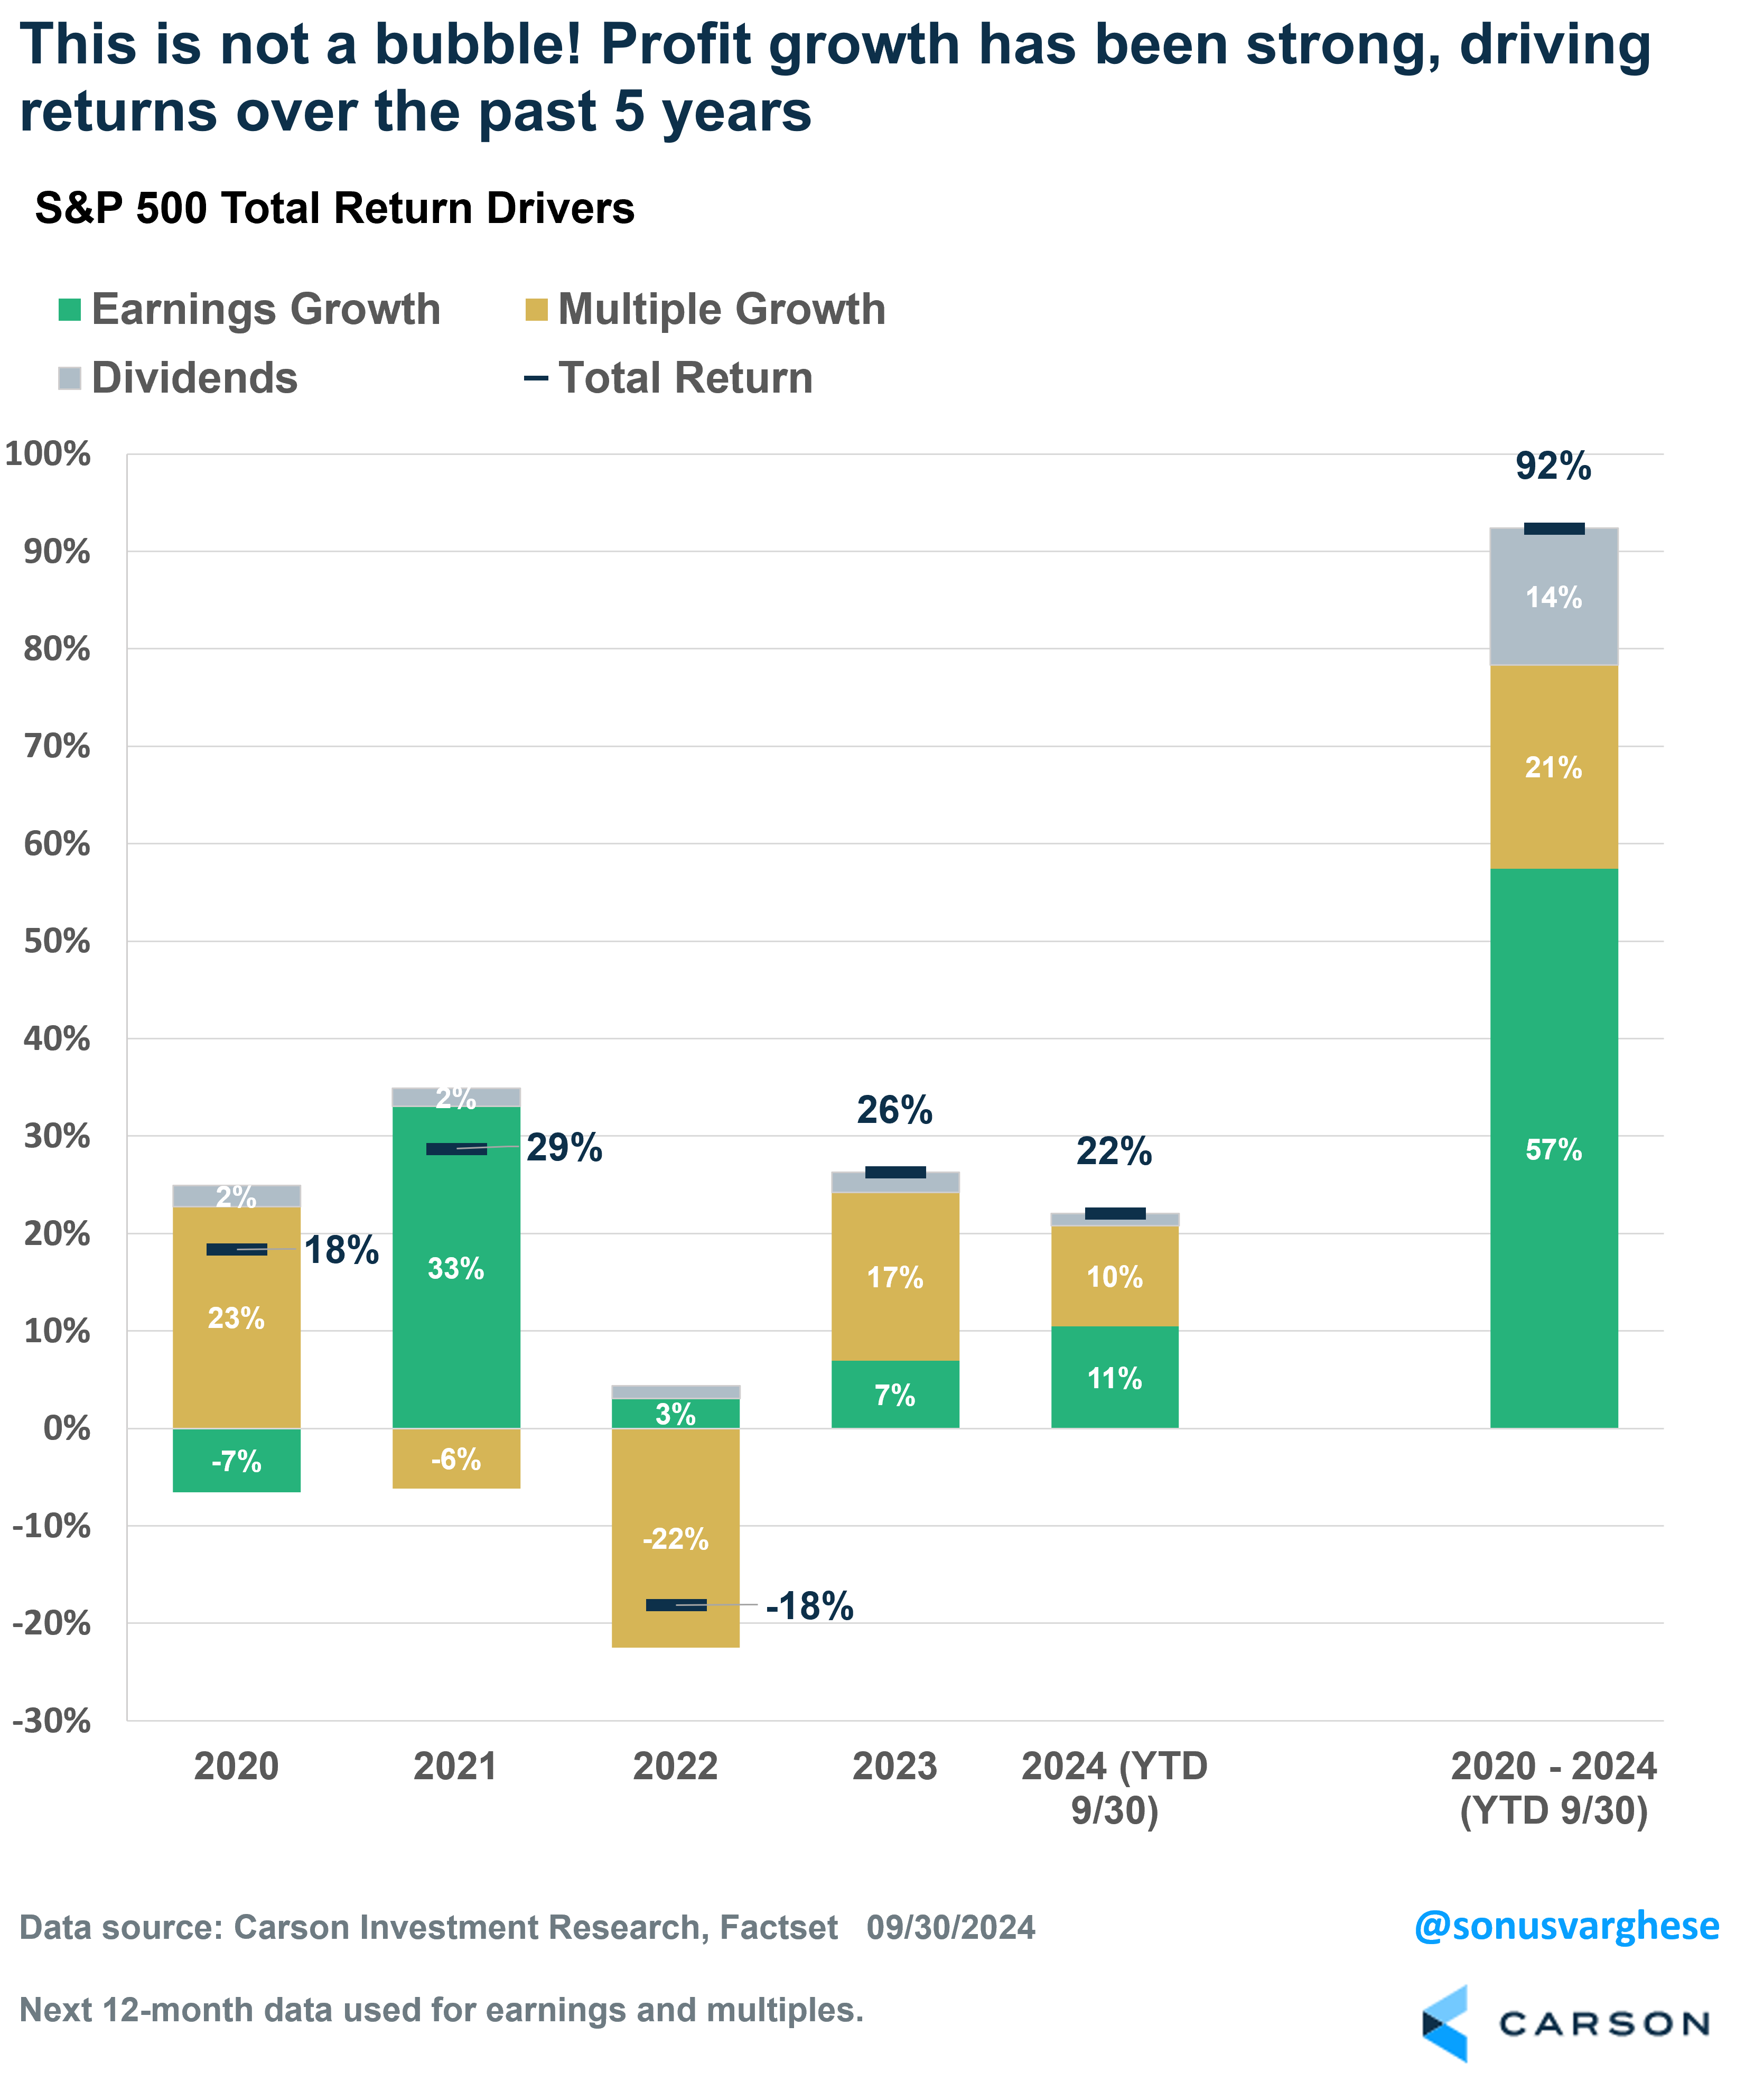
But even if you want to take the economic data with buckets of salt, just look at the market. The S&P 500 was up 22% over the first nine months of the year, and over half of that return has been powered by corporate profit growth. Since the end of 2019, the S&P 500 is up 92%, of which
- Earnings growth has contributed 57%-points
- Dividends contributed 14%-points
- Valuation multiple growth contributed 21%-points
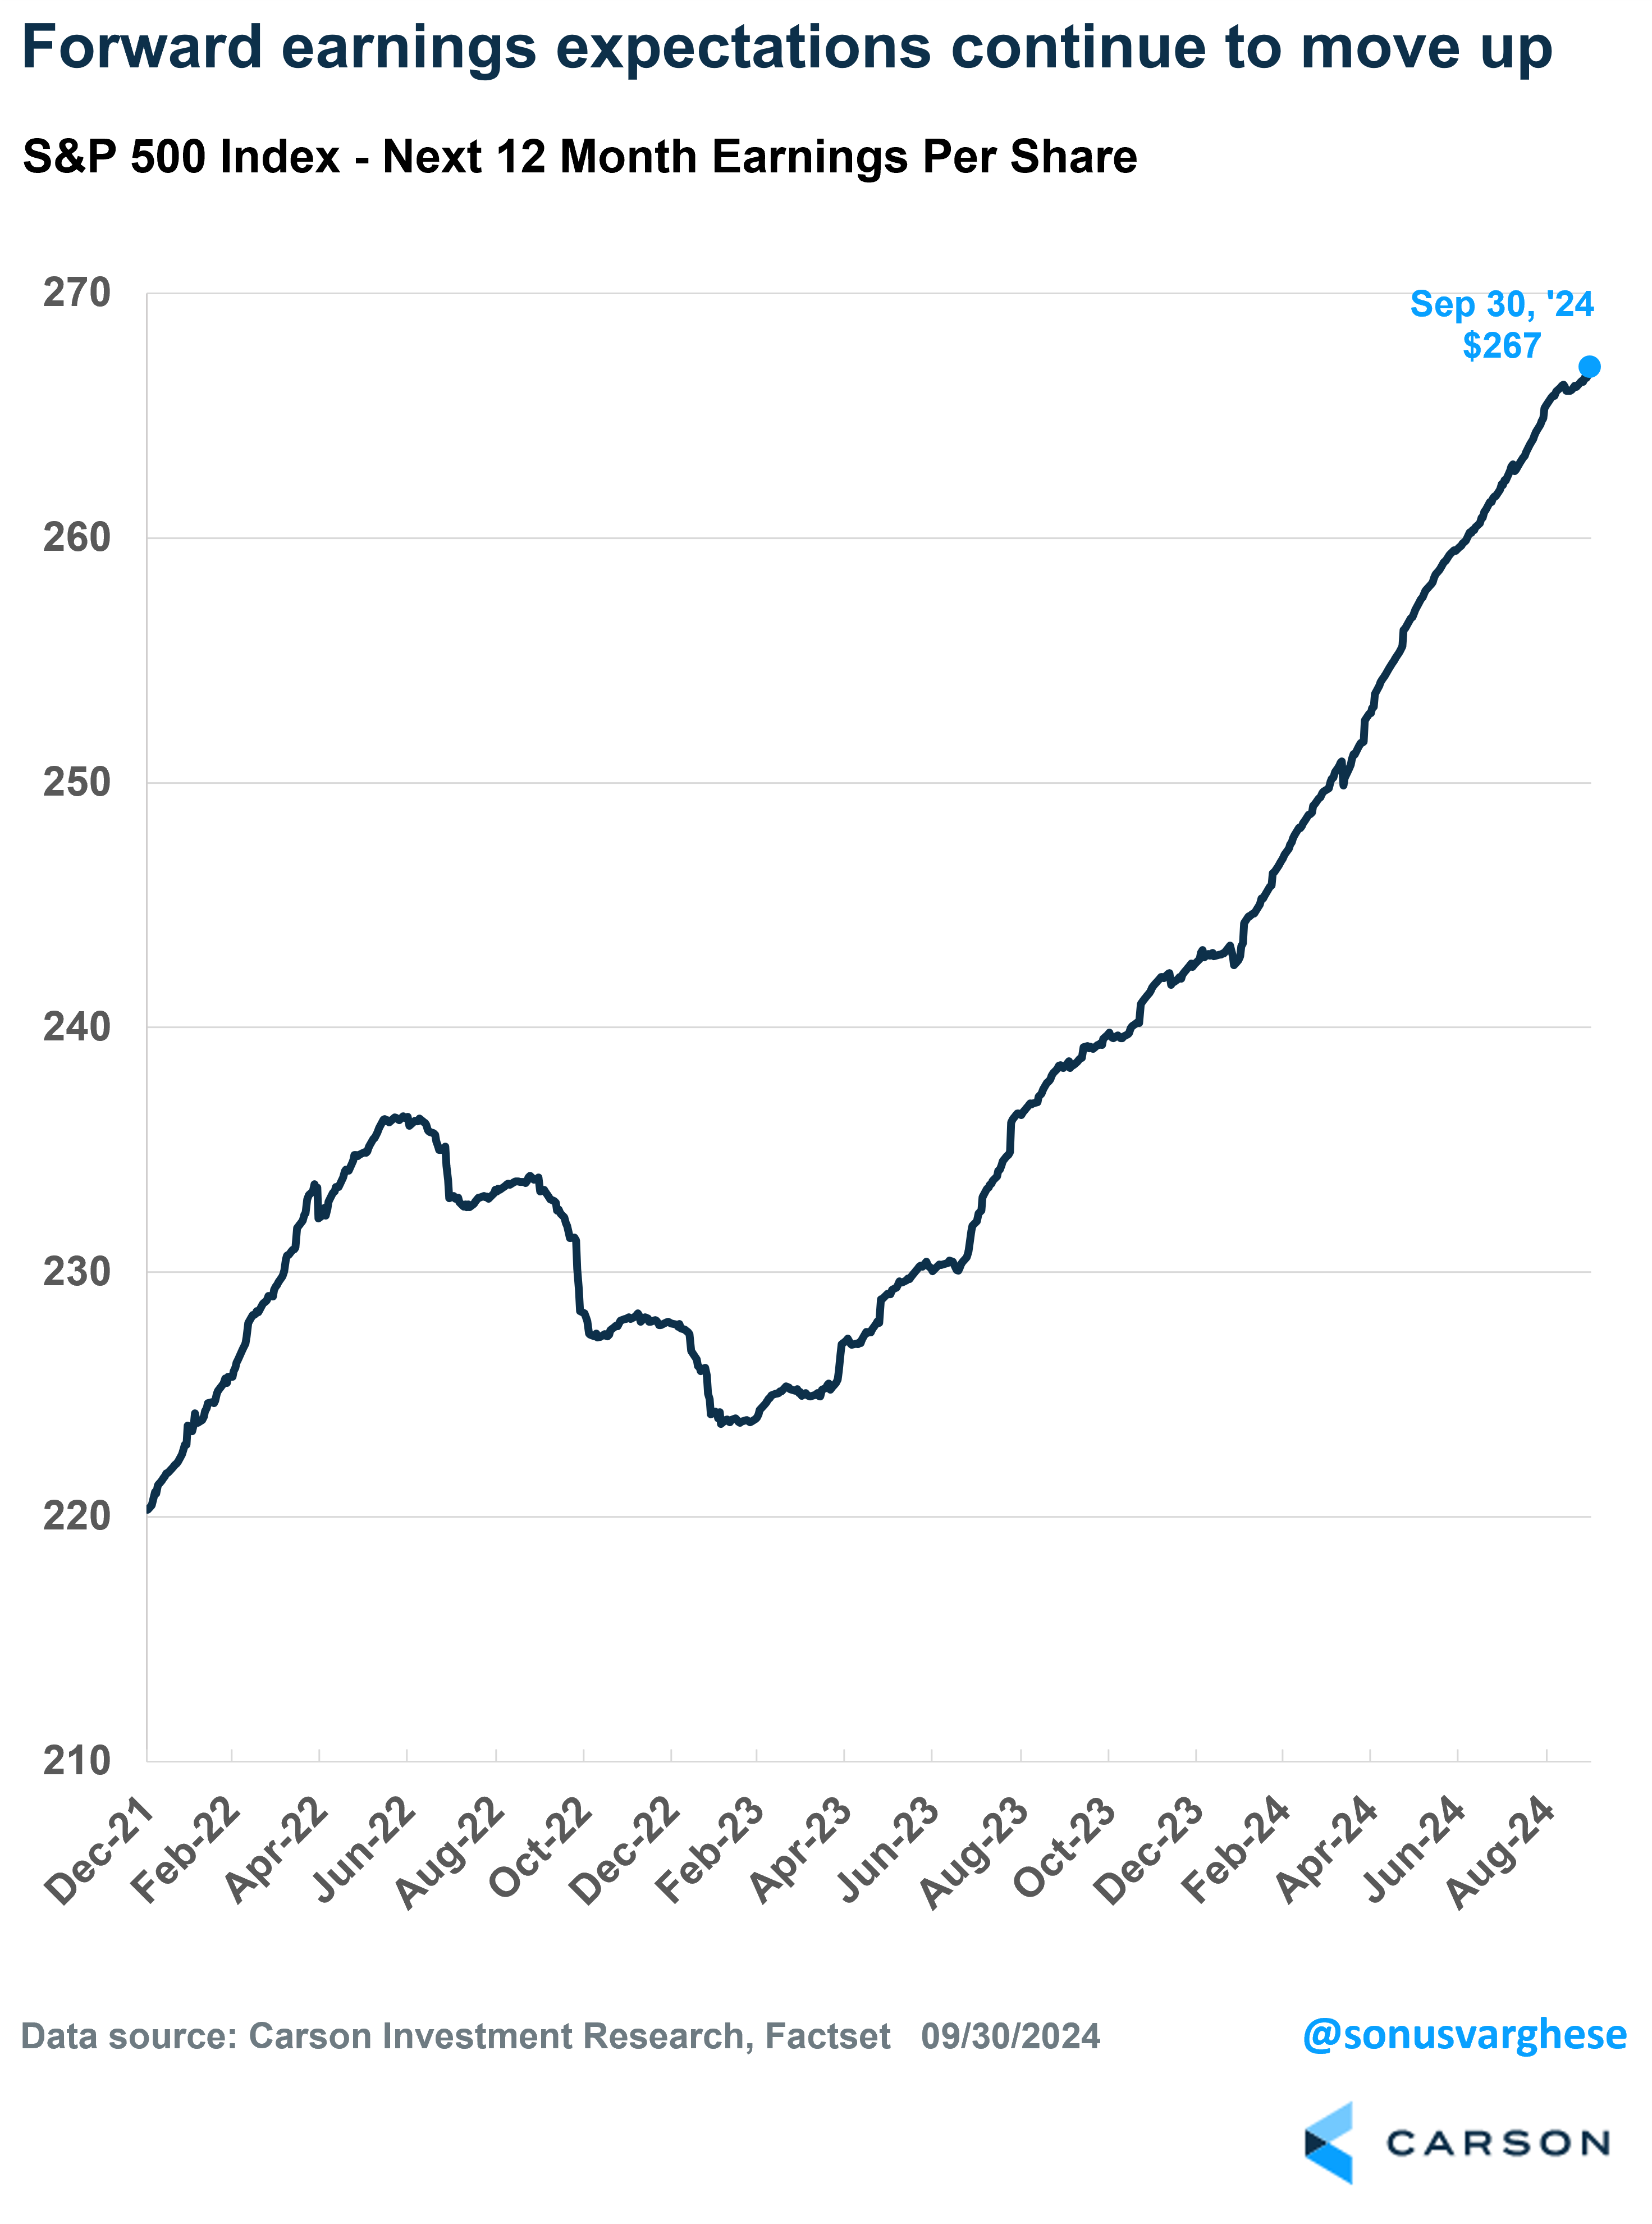
In other words, most of the returns have come from profits (and dividends). Profit expectations continue to move higher, driven by strong sales growth (which tells you that the economy is doing well) and profits margin growth (which tells you companies are in good shape and have operating leverage).
At the end of the day, profits come from the economy, and that’s what drives market returns. So, if you don’t want to believe economic data, hopefully you can believe what markets are telling us about the economy. That’s real money.
For more content by Sonu Varghese, VP, Global Macro Strategist click here.
02443268-1001-A

