
We just got a slew of economic data revisions from the Bureau of Economic Analysis (BEA) and my first response was, Wow! A lot of this is backward-looking data, but it’s important to (re) level-set where we are, and the momentum associated with that. As my colleague Barry Gilbert said to me after these revisions, it shifts the forward-looking perspective, because we’re standing in a different place than we thought.
Stay on Top of Market Trends
The Carson Investment Research newsletter offers up-to-date market news, analysis and insights. Subscribe today!
"*" indicates required fields
Let’s start here: GDP growth over the last 5 years was revised up. From the end of 2019 through 2024 Q2, real GDP growth was revised up from 9.4% to 10.7%. Here’s some perspective on that upward revision of 1.3%-point:
- Germany grew just 0.3% over the entire period (hard to call it “growth”)
- The UK grew 2.3%
- Japan grew 3.0%
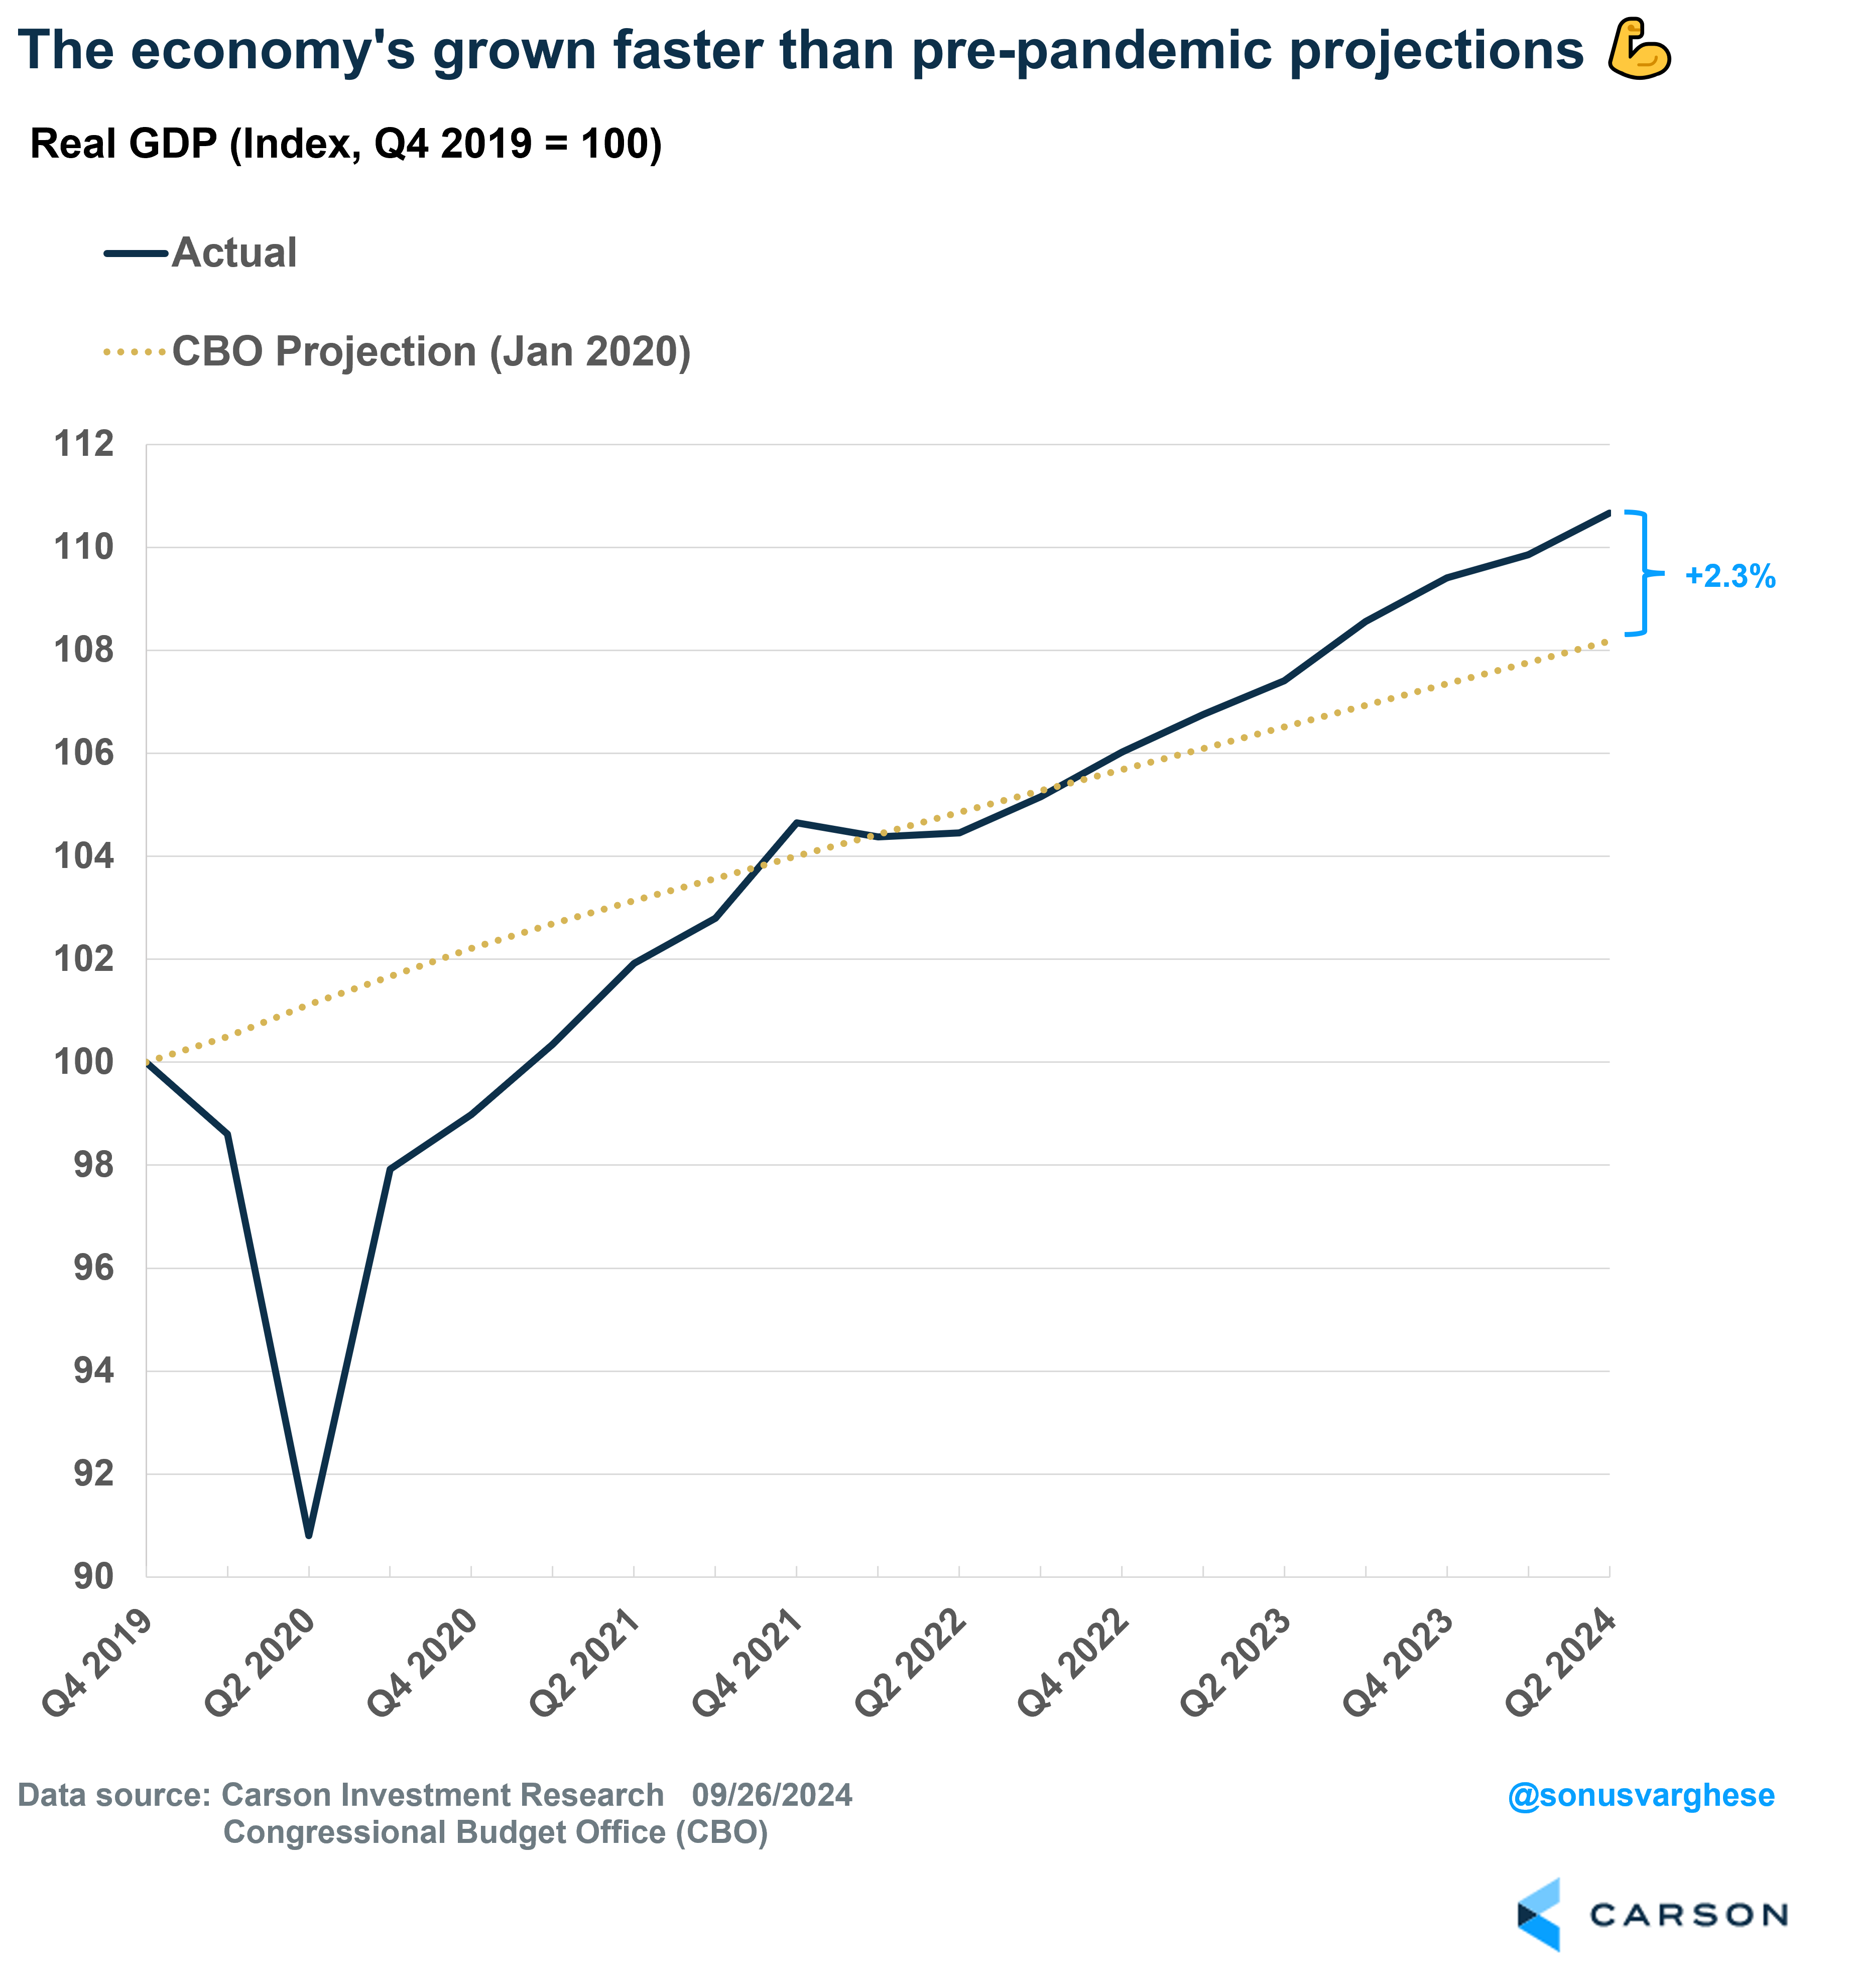
One of my favorite charts is the one below, which compares Congressional Budget Office (CBO) pre-pandemic projections for growth to actual growth. Actual real GDP growth is running 2.3% above what the CBO projected back in January 2020. Remember, this is after a worldwide pandemic, 40+ year highs in inflation, and an ultra-aggressive Fed. There’s a reason why the S&P 500 has risen over 90% over this same period, and that was because economic activity drove profit growth (I wrote about this earlier this week).
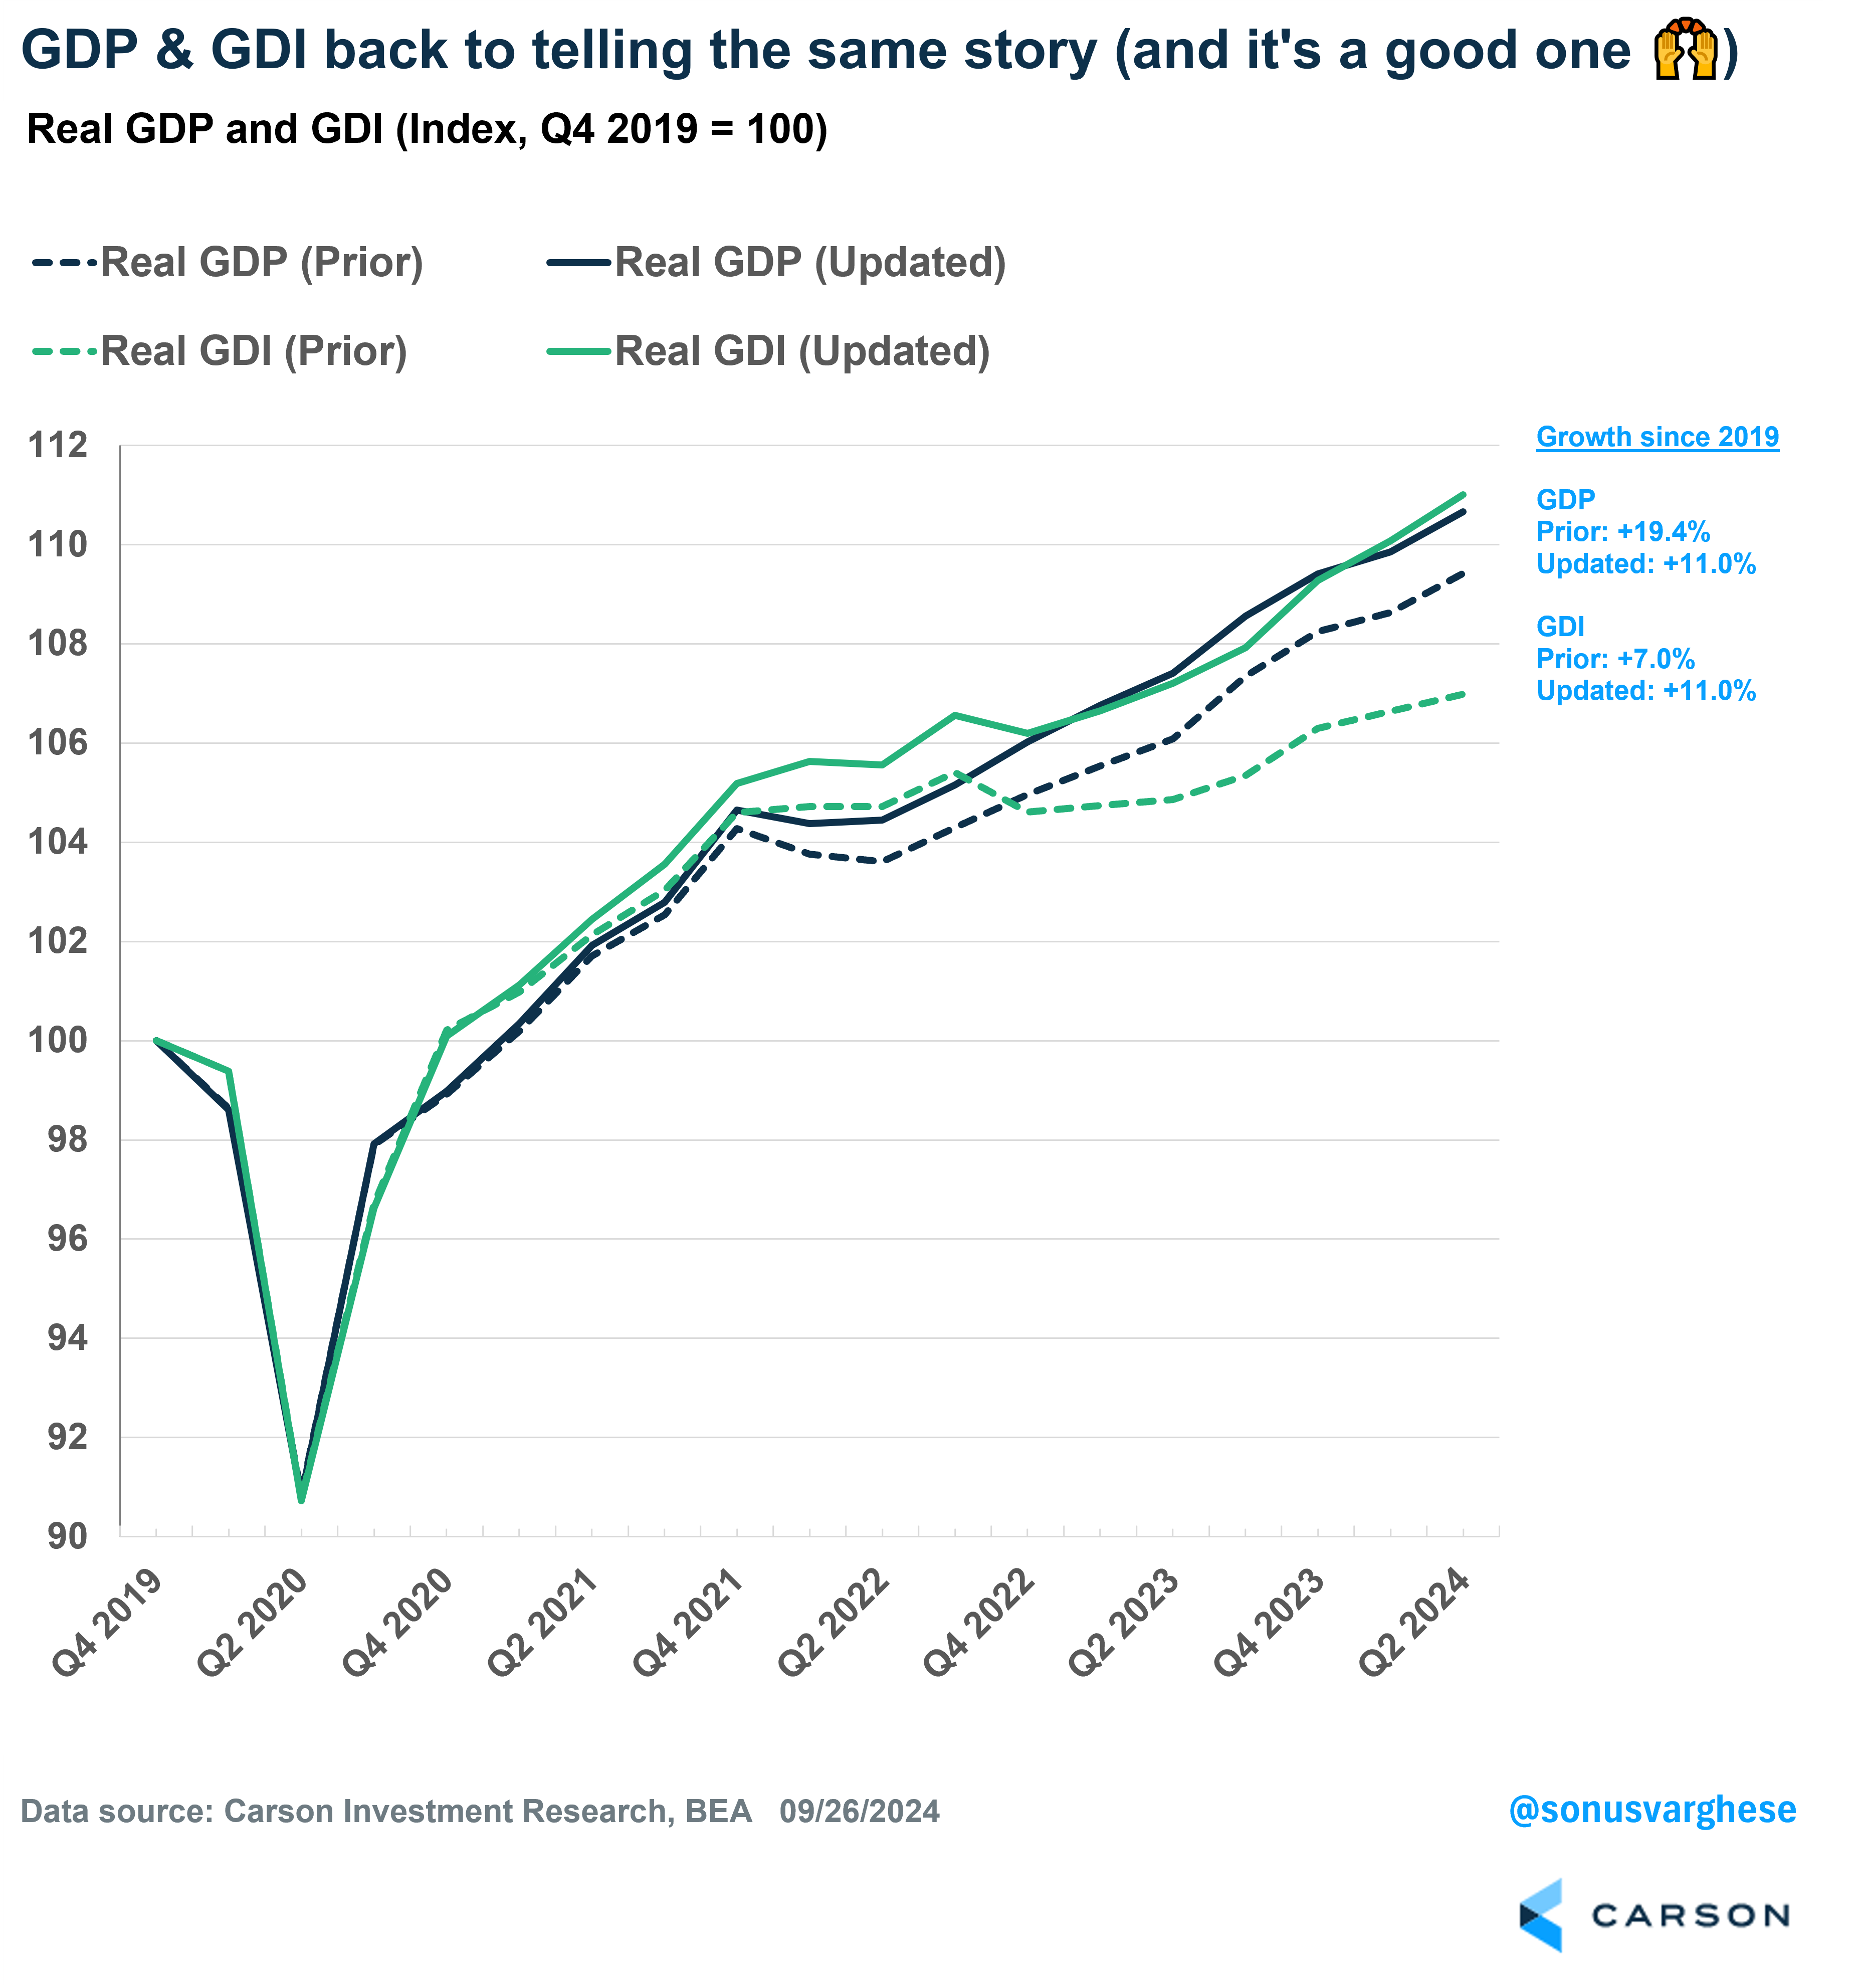
There’s more: Gross Domestic Income (GDI) was also revised higher, by a lot. GDP and GDI are both measure of output. GDP measures production/sales (household consumption, investment, government spending, net exports), whereas GDI measures incomes (labor income, interest, profits, etc.). In theory, they should be the same, but they differ because the data sources are entirely different. The divergence was huge, until the revisions. Real GDI growth was revised up significantly. For the end of 2019 through 2024 Q2, it was revised up from 7% to 11%. There was a bearish narrative that GDP would be revised down to GDI (there was never a basis for that), but now GDI growth is actually outpacing GDP in the post-Covid era.
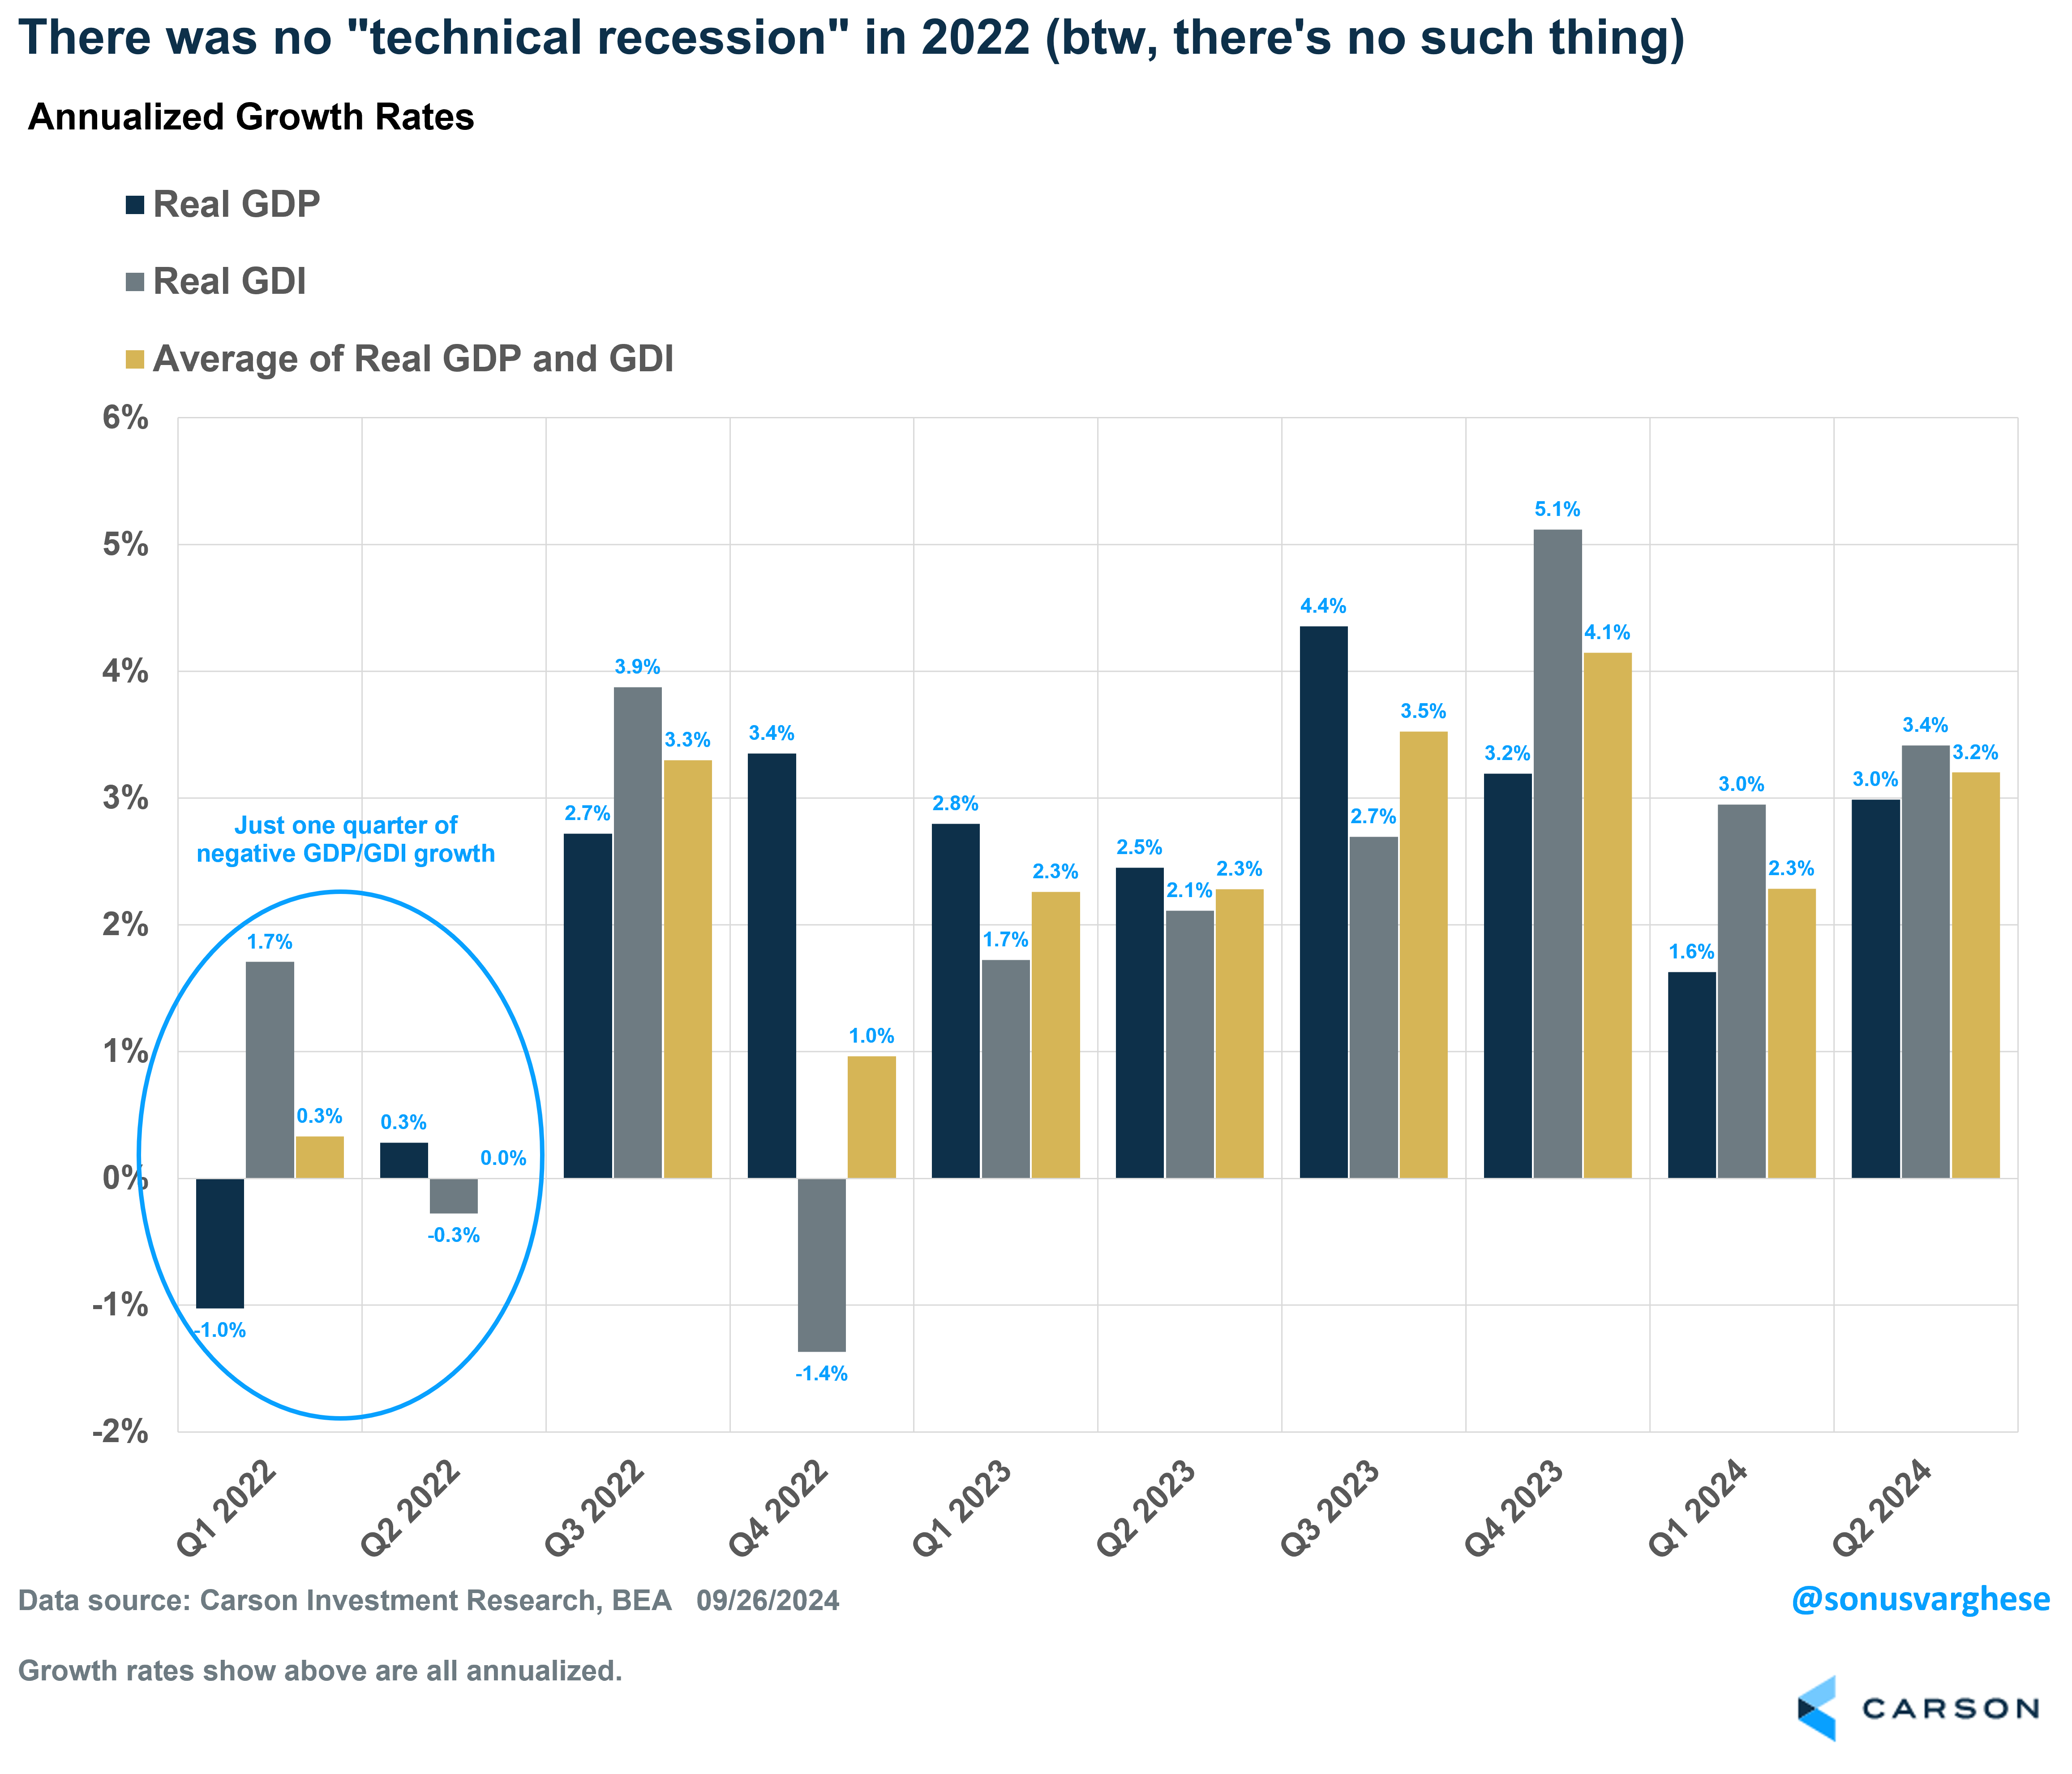
By the way, with the revision there was no “technical recession” in 2022. A technical recession is colloquially described as two consecutive quarters of negative GDP growth. However, it’s typically used for countries other than the US. That’s because in the US, a recession is officially “dated” by the National Bureau of Economic Research (NBER). The NBER recession dating committee does not use GDP (or GDI), instead focusing on six other economic indicators measuring consumption, income, employment, sales and production. The prior data showed that GDP growth was negative in Q1 and Q2 of 2022, prompting a hue and cry from the bears who were apoplectic that a recession wasn’t “called.” Never mind that most economic indicators pointed away from a recession even in mid-2022. Ryan and I spent a lot of time pushing back against the recession narrative over the last two years, whether on the Facts vs Feelings podcast, blogs, and even our Outlooks. Well, Q2 2022 GDP growth was revised up, and now we don’t have two consecutive quarters of negative GDP growth (or GDI for that matter). Another narrative bites the dust.
Here’s something that is hardly being talked about, and ought to be celebrated: over the last two years, real GDP growth has clocked in at an annualized pace of 2.9%, and over the last year it’s up 3.0%. The economy grew at an annualized pace of 2.4% over the entire 2010-2019 era, and even over the relatively stronger 2017-2019 period, it grew 2.8%.
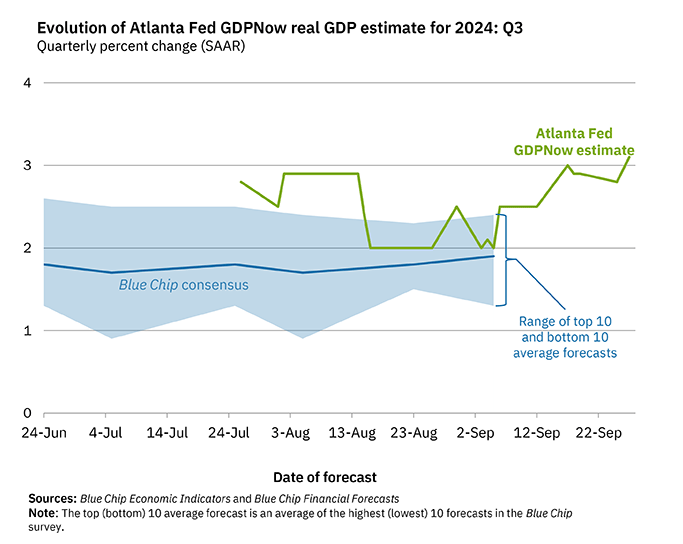
That’s obviously backward-looking data, but as of now, the Atlanta Fed is projecting Q3 GDP growth at 3.1%, on the back of strong consumption and investment spending. The momentum continues.
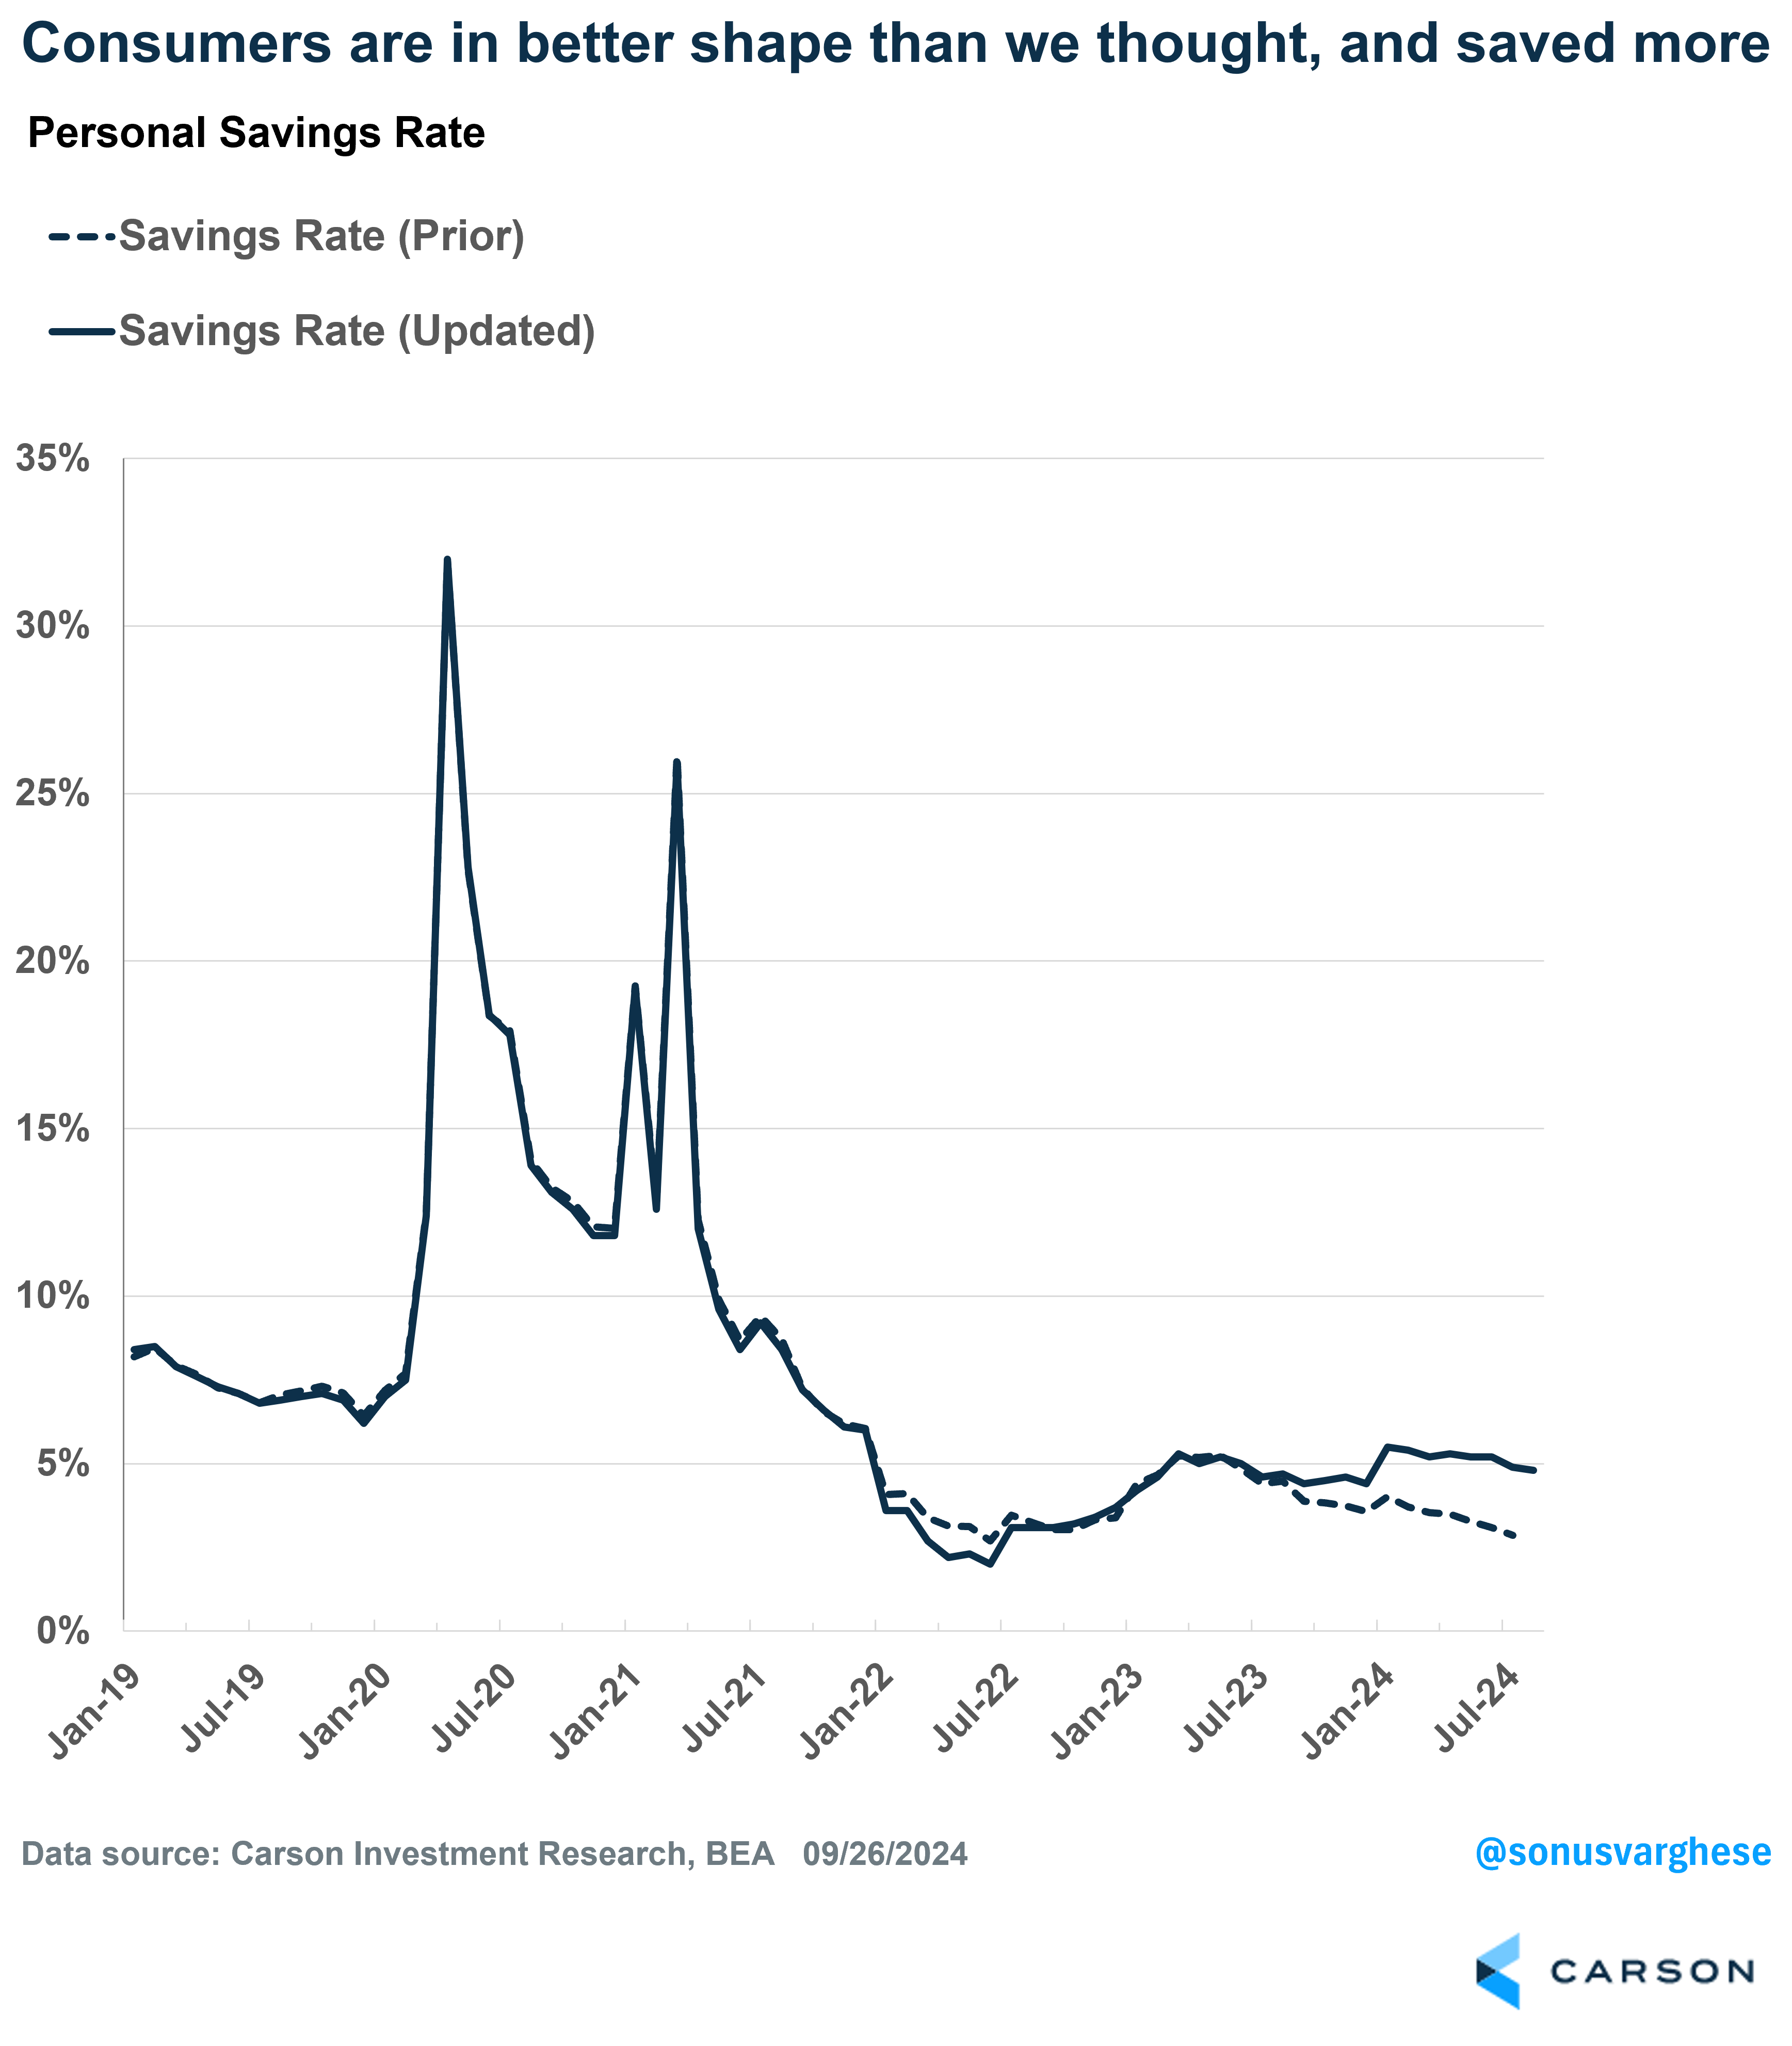
Consumers Are in Better Shape Than We Thought
GDI was revised up on the back of stronger income growth for households and corporations (i.e. profits). Disposable income for households was revised higher, even as durable goods consumption was revised down. (Turns out Americans didn’t spend as much on durable goods like cars and recreational goods as we first thought.) As a result, the savings rate was revised up from 3.3% to 5.2% in Q2 2024. That’s lower than the 2019 average of 7.3%, but not that much lower. And remember that 2019 came at the end of a massive deleveraging cycle, as households were repairing their balance sheets after the financial crisis (which crushed stock and home prices).
By The Way, There’s No Manufacturing Recession
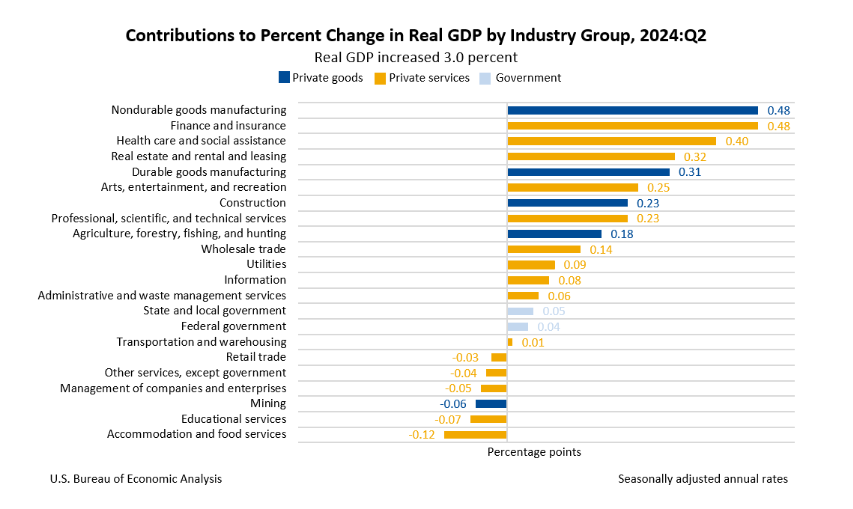
Survey data from the manufacturing sector have told us that the manufacturing sector has been in contraction for the last two years. The ISM Manufacturing PMI (a survey of purchasing managers) averaged 48.8 in Q2 2024 (any reading below 50 indicates the sector is in contraction). But with the GDP/GDI data, we also got “industry value add” data, which is actually a third way to measure output, this time aggregating output across various private sector categories, and the public sector. Turns out, real GDP grew 3.0% annualized in Q2 2024, and of that, 0.79%-points came from the manufacturing sector. That’s a quarter of the growth rate contributed by a sector that makes up just about 10% of the economy, and supposedly is in a recession. Over the last year, through Q2 2024, real manufacturing output has increased by 3.9%.
Underrated but Hugely Important: The Investment and Productivity Story
A big driver of upward revisions to GDP was investment, which more than overcame the downward revision to goods consumption over the last few years. We’ve written extensively about productivity, and how tight labor markets and investment are key to its growth, including in our 2024 outlook. Productivity gains allow for strong wage growth without excessive inflation. Turns out that’s the story of the US economy over the last year and half.
Upward GDP growth revisions imply productivity growth is likely stronger than reported. It was already strong, running at a 2.9% annualized pace over the last five quarters (compared to a 1.5% annualized pace from 2005-2019). Income growth has been really strong as well, with employee compensation running up over 6% over the past year through August. Yet, inflation has continuously eased. The core personal consumption expenditures index (PCE), which is the Fed’s preferred inflation metric, has eased from 3.8% a year ago to 2.7% as of August 2024. Over the last 3 months, it’s running at a 2.1% annualized pace, barely above the Federal Reserve’s (Fed) 2% target.
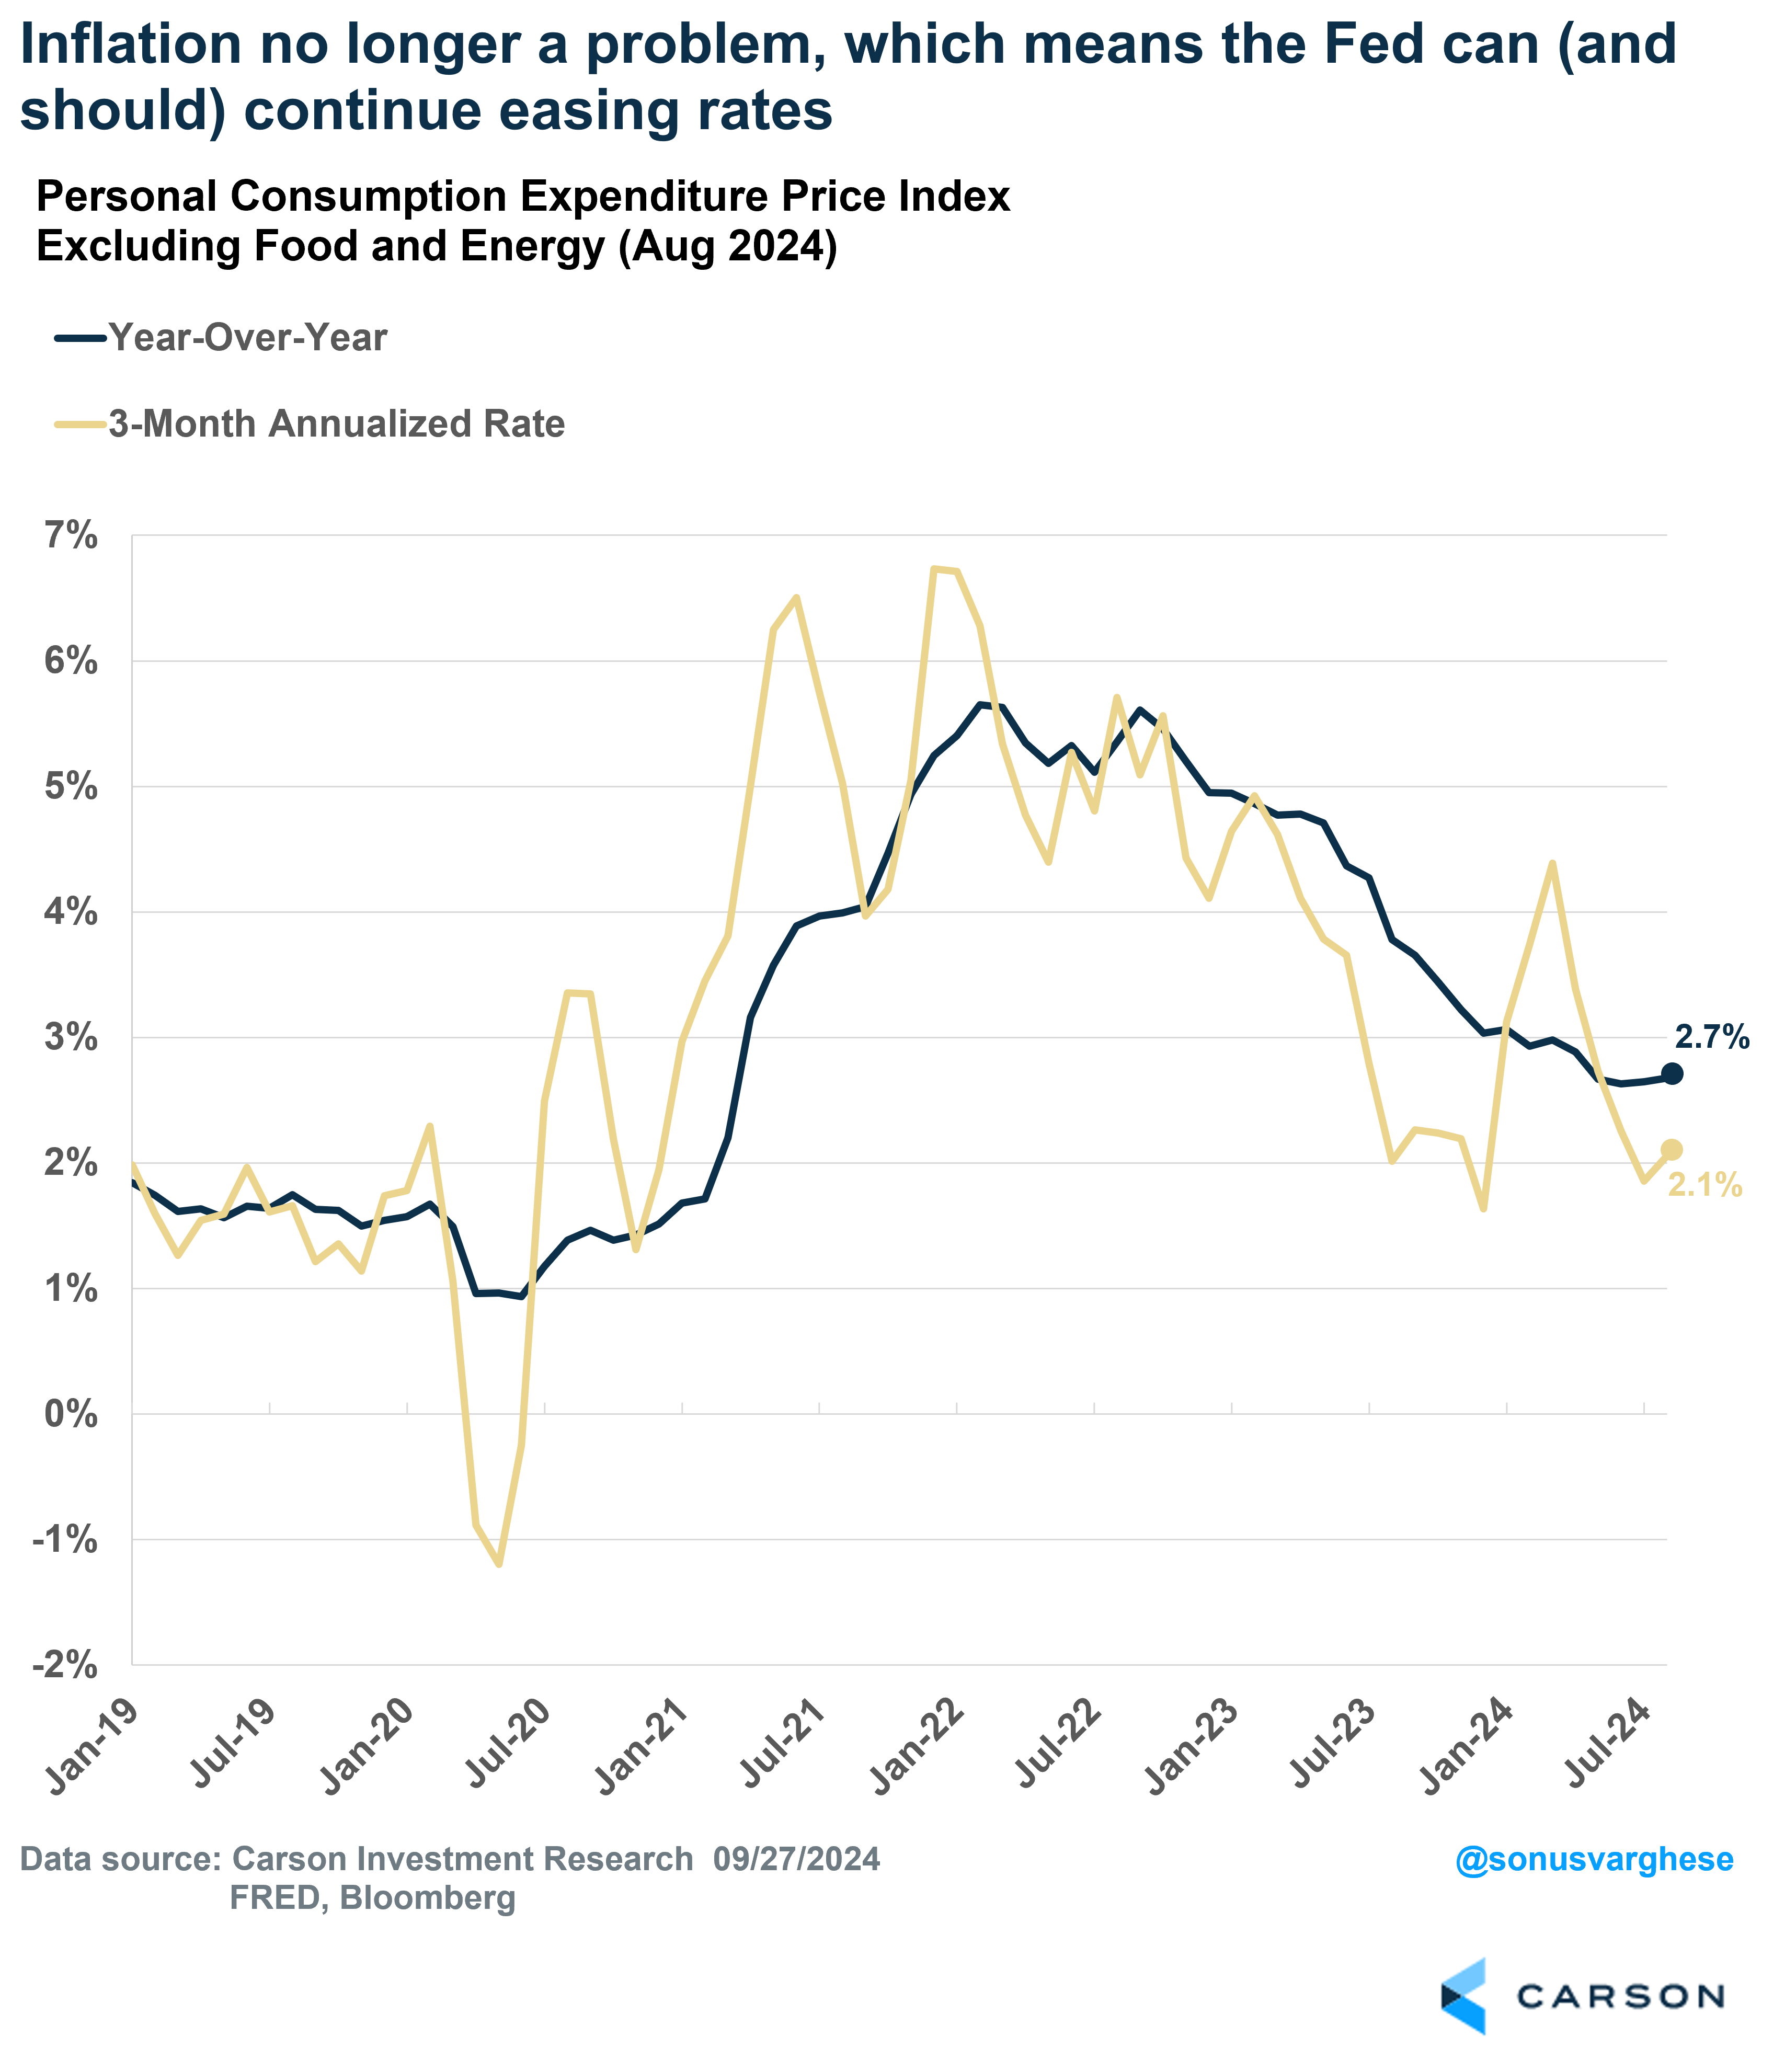
Like we’ve been saying since the beginning of the year, inflation is no longer a problem. The good news is that the Fed is recognizing this and signaled real intentionality at their September meeting to protect the labor market (by cutting 0.5%-points). A strong labor market is also key to productivity growth, boosting investment and keeping inflation benign. That will allow the Fed to continue easing interest rates, which will be a tailwind for the economy and markets.
For more content by Sonu Varghese, VP, Global Macro Strategist click here.
02432847-0924-A