
Here’s the Real Dry Powder That Matters
There’s been a lot of questions about the $6 trillion sitting in money market funds (MMF), and what’s going to happen to it as interest rates drop. Ben Carlson, Director of Institutional Asset Management at Ritholz Wealth Management, who pens the “Wealth of Common Sense” blog, wrote a nice piece on this recently — he was responding to a question about whether these funds would go into the stock market. He found that money market funds have not acted like “cash on the sidelines” in the past. He pointed out that a lot of the money that’s in MMFs likely came from bonds, especially in 2022 when bonds were plunging. That makes sense to me. From the vantage point of being in a position of managing model portfolios on the Carson platform, I can start to see cash moving back into longer maturity bonds, as investors look to lock in higher yields, though this is happening only slowly.
In any case, if the cash sitting in MMFs were going to find their way to the stock market, you’d think that would’ve already happened over the past year and half of a bull market. Why wait until now? On the contrary, recent record highs have a lot of folks actually worried about the market being stretched, rather than a reason to buy more equities (which it should be, since momentum begets momentum). Also color me skeptical about the whole notion of “cash on the sidelines.” As Cliff Asness co-founder of AQR points out,
There are no sidelines. Those saying this seem to envision a seller of stocks moving her money to cash and awaiting a chance to return. But they always ignore that this seller sold to somebody, who presumably moved a precisely equal amount of cash off the sidelines.
I wrote in a prior blog that recent record highs have been mostly powered by profit growth, including sales growth and margin expansion, rather than valuation expansion. Over the long run, it’s really profit growth that matters. And profits are generated through economic activity. Here it gets interesting.
Stay on Top of Market Trends
The Carson Investment Research newsletter offers up-to-date market news, analysis and insights. Subscribe today!
"*" indicates required fields
Household Balance Sheets Look Pretty Good Across Income Levels
The economic cycle over the last two years has confounded most economists and market forecasters (save for a few, including us I dare say). But a key piece of the puzzle was that economic activity was driven by income growth that benefited from a strong labor market, rather than credit growth, unlike in prior cycles. Looking at household balance sheets, liabilities as a percent of disposable income is sitting at the same place it was back in 2019 (~ 100%). Note that 2019 was at the end of a massive deleveraging cycle, as households looked to improve their balance sheets after the 2008 financial crisis wrecked it with both a stock market and real estate crash. In contrast, post-Covid we’ve seen the asset side of the household balance sheet continue to surge, thanks to rising stock prices and home prices. Assets minus liabilities as a percent of disposable income is currently at a record 760%.
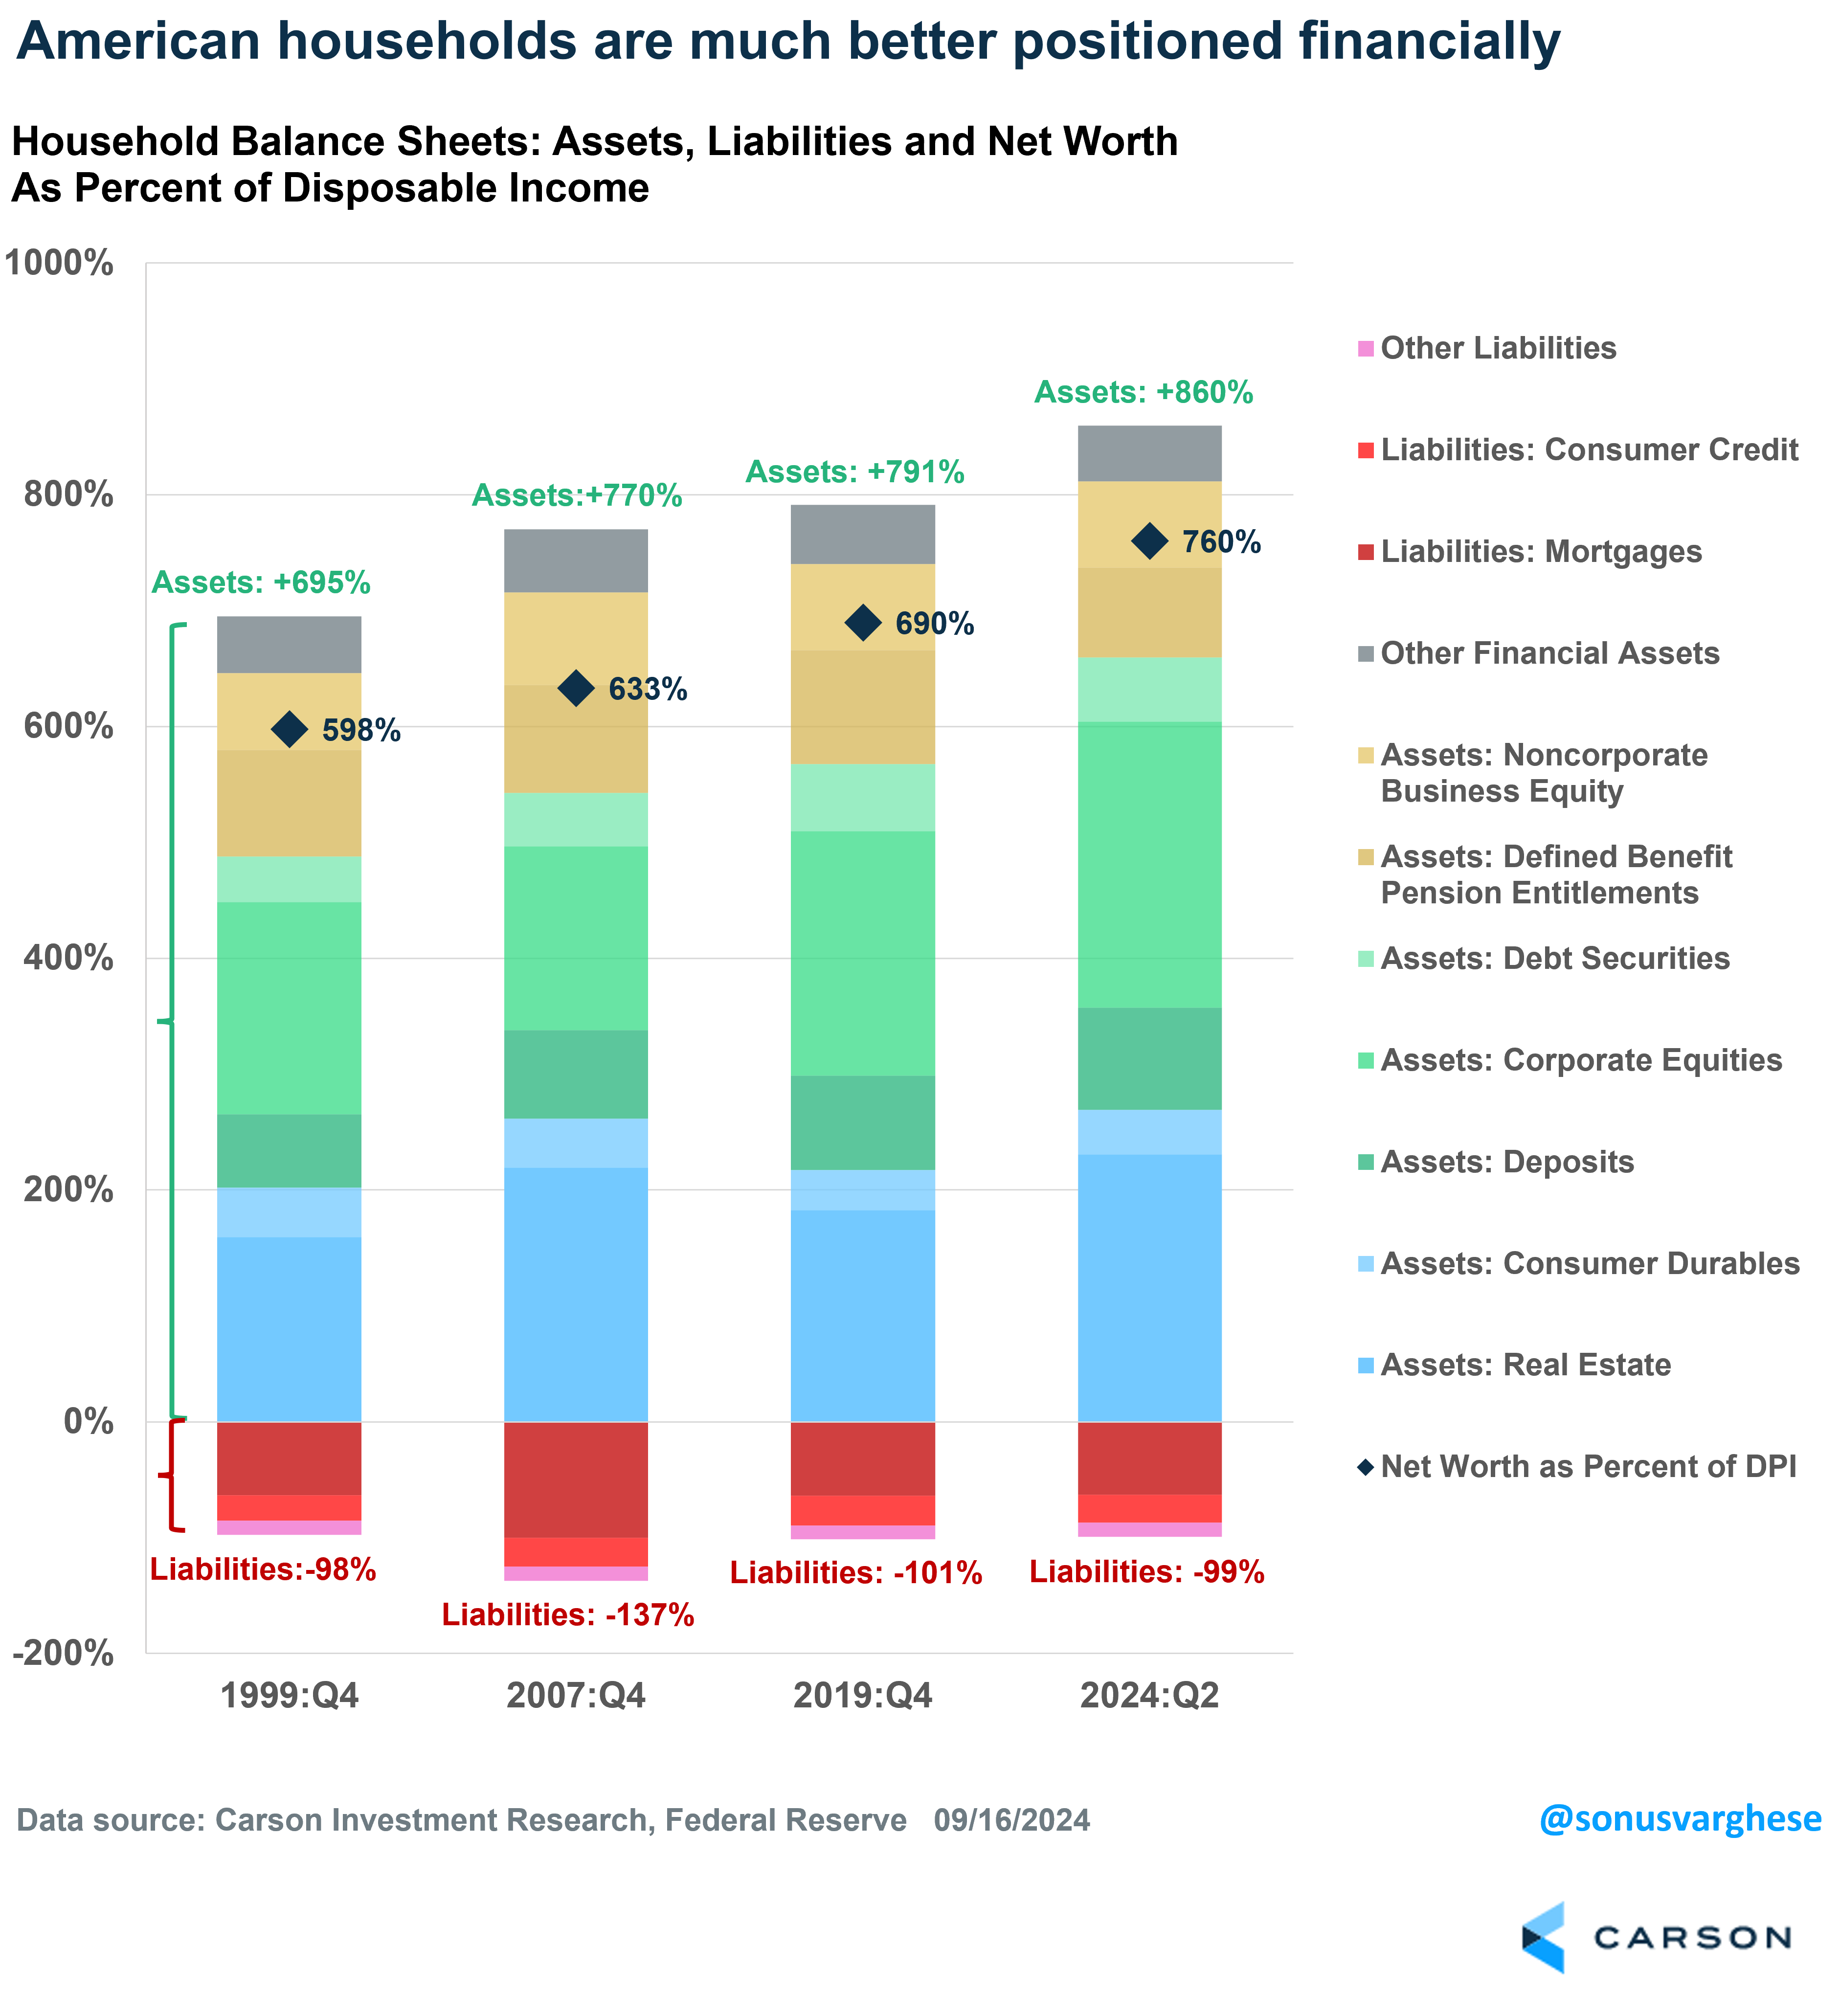
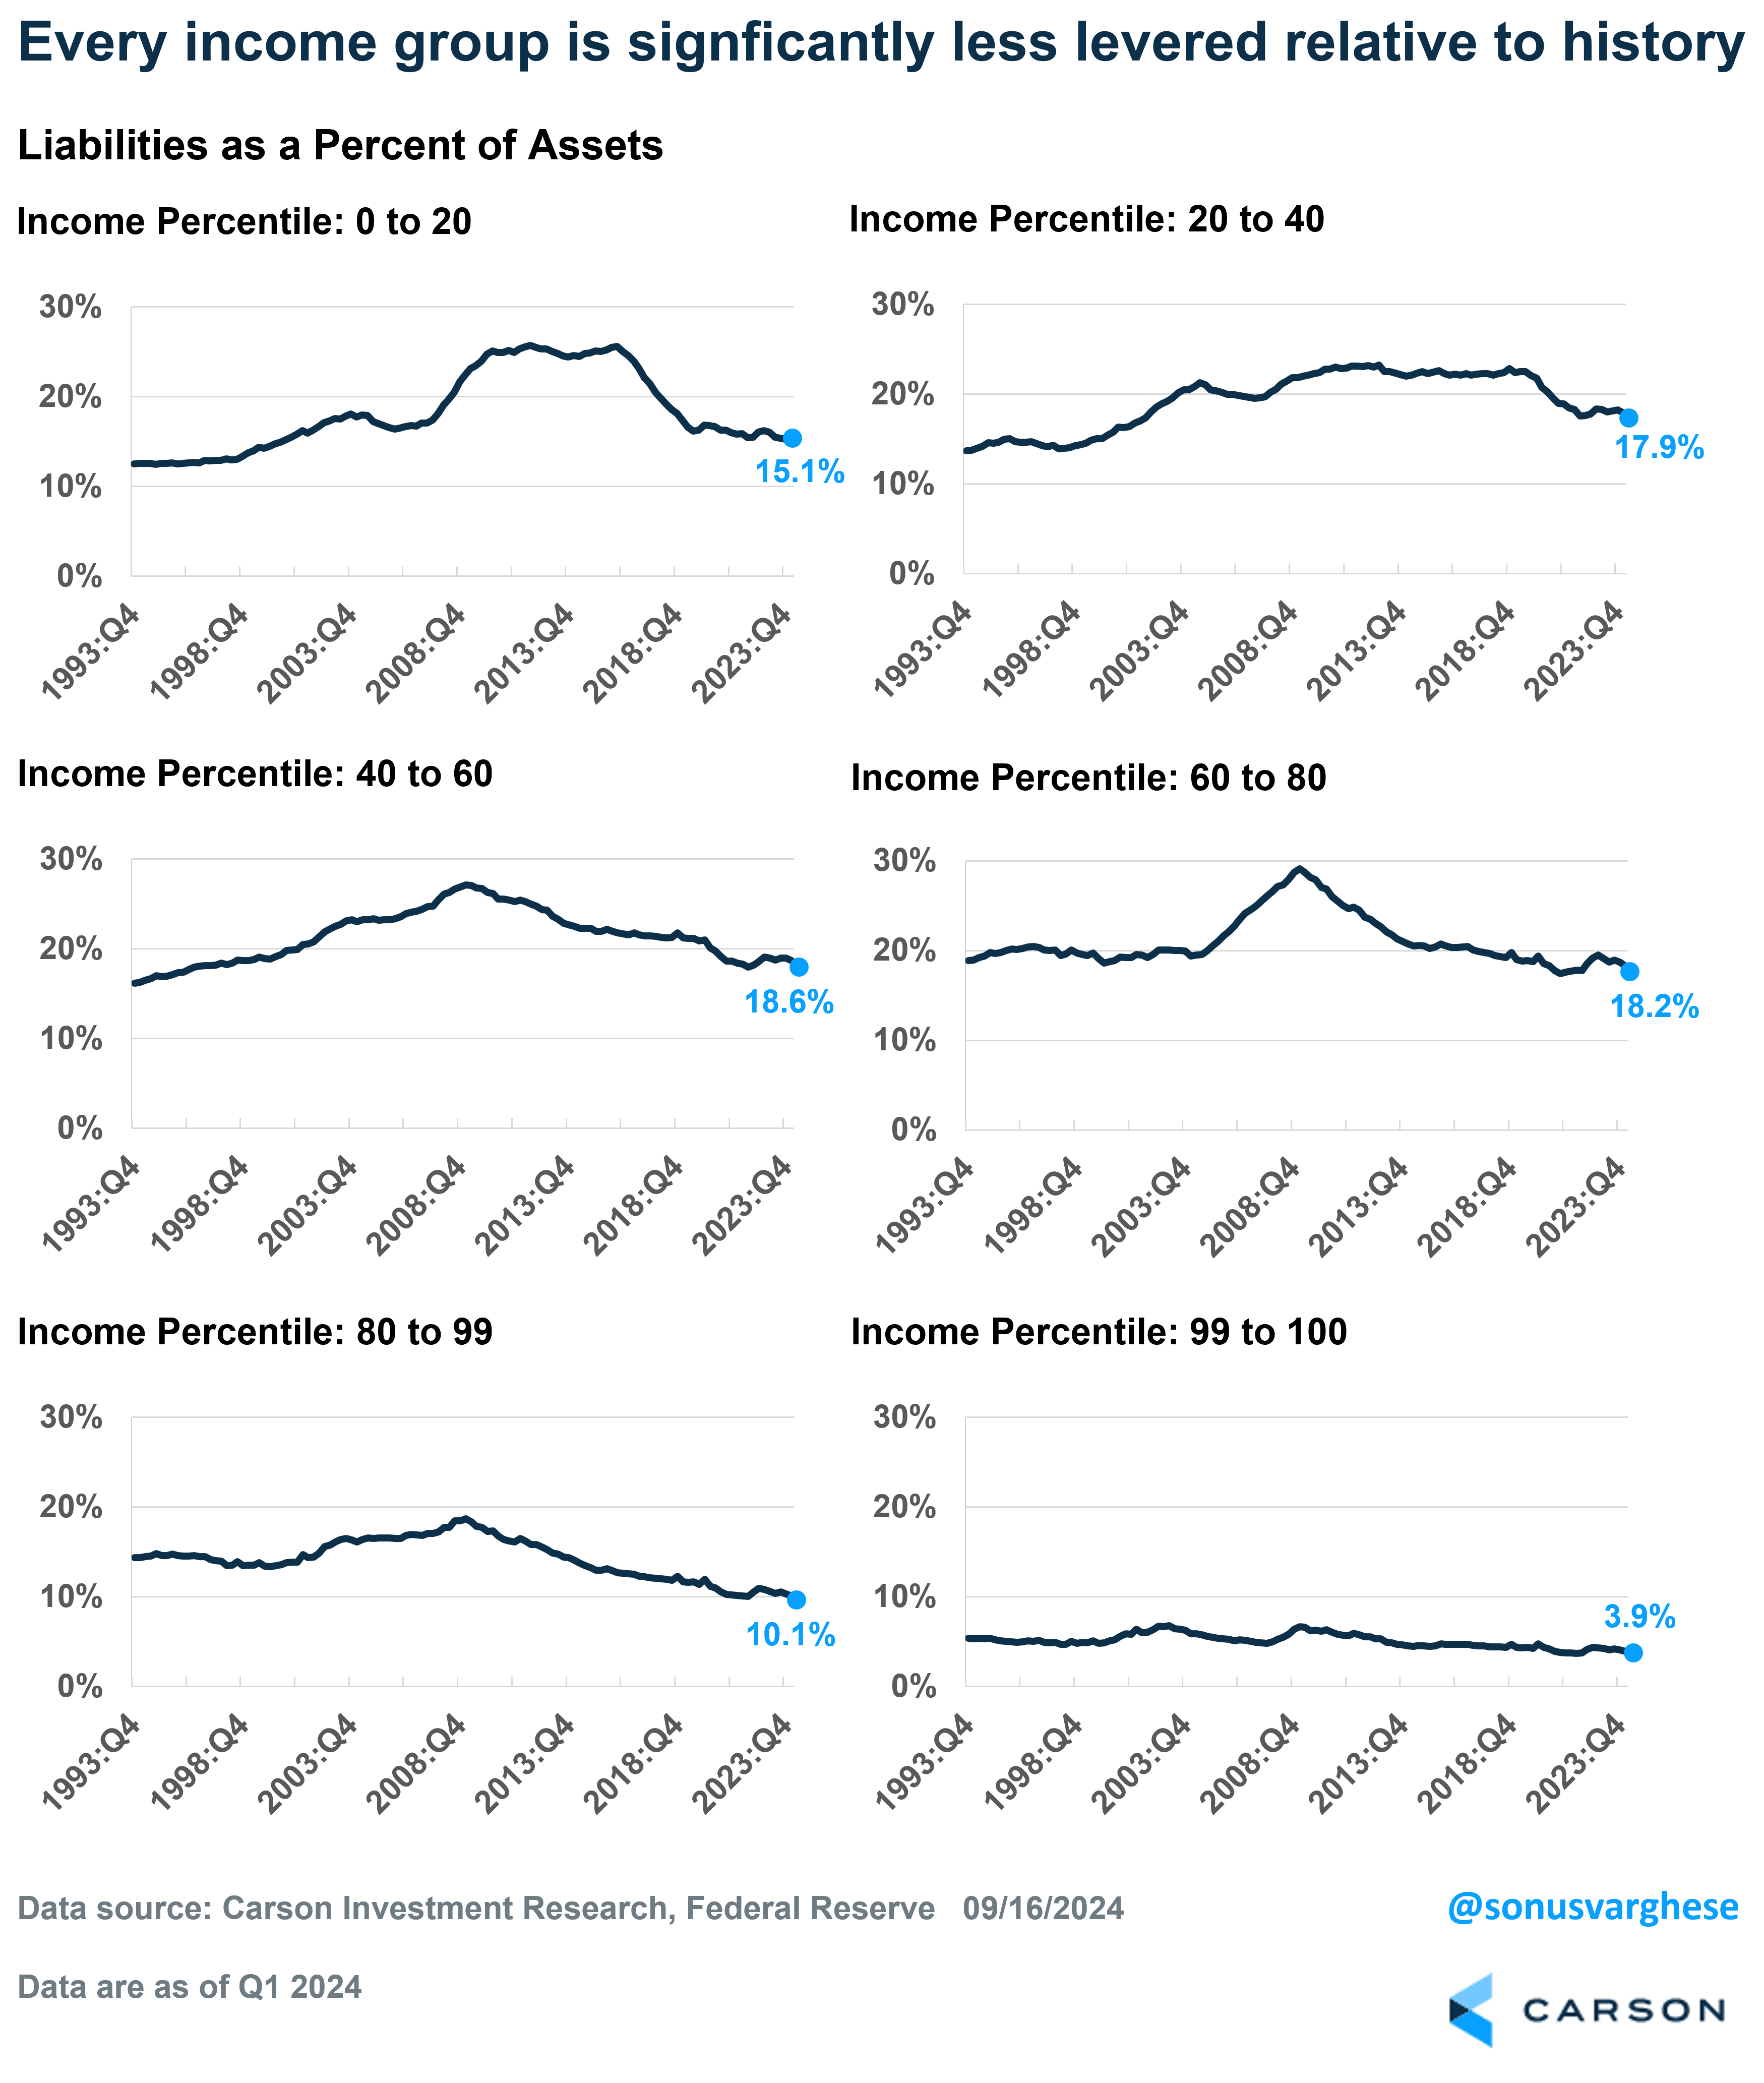
One knock against the above chart is that it’s an aggregate. But even if you look at households by income, every quintile is significantly less levered, with liabilities as a percent of assets well below historical levels.
The Real Dry Powder
The improved balance sheet position of households is the real dry powder for the economy. As interest rates ease, we could start to see credit growth start to increase and drive economic activity. In fact, Fed rate cuts have an almost immediate impact on certain pockets of the economy since their policy rate is tied to the “prime rate” that drives loan rates for home equity lines of credit (HELOC), auto loans, and small business loans.
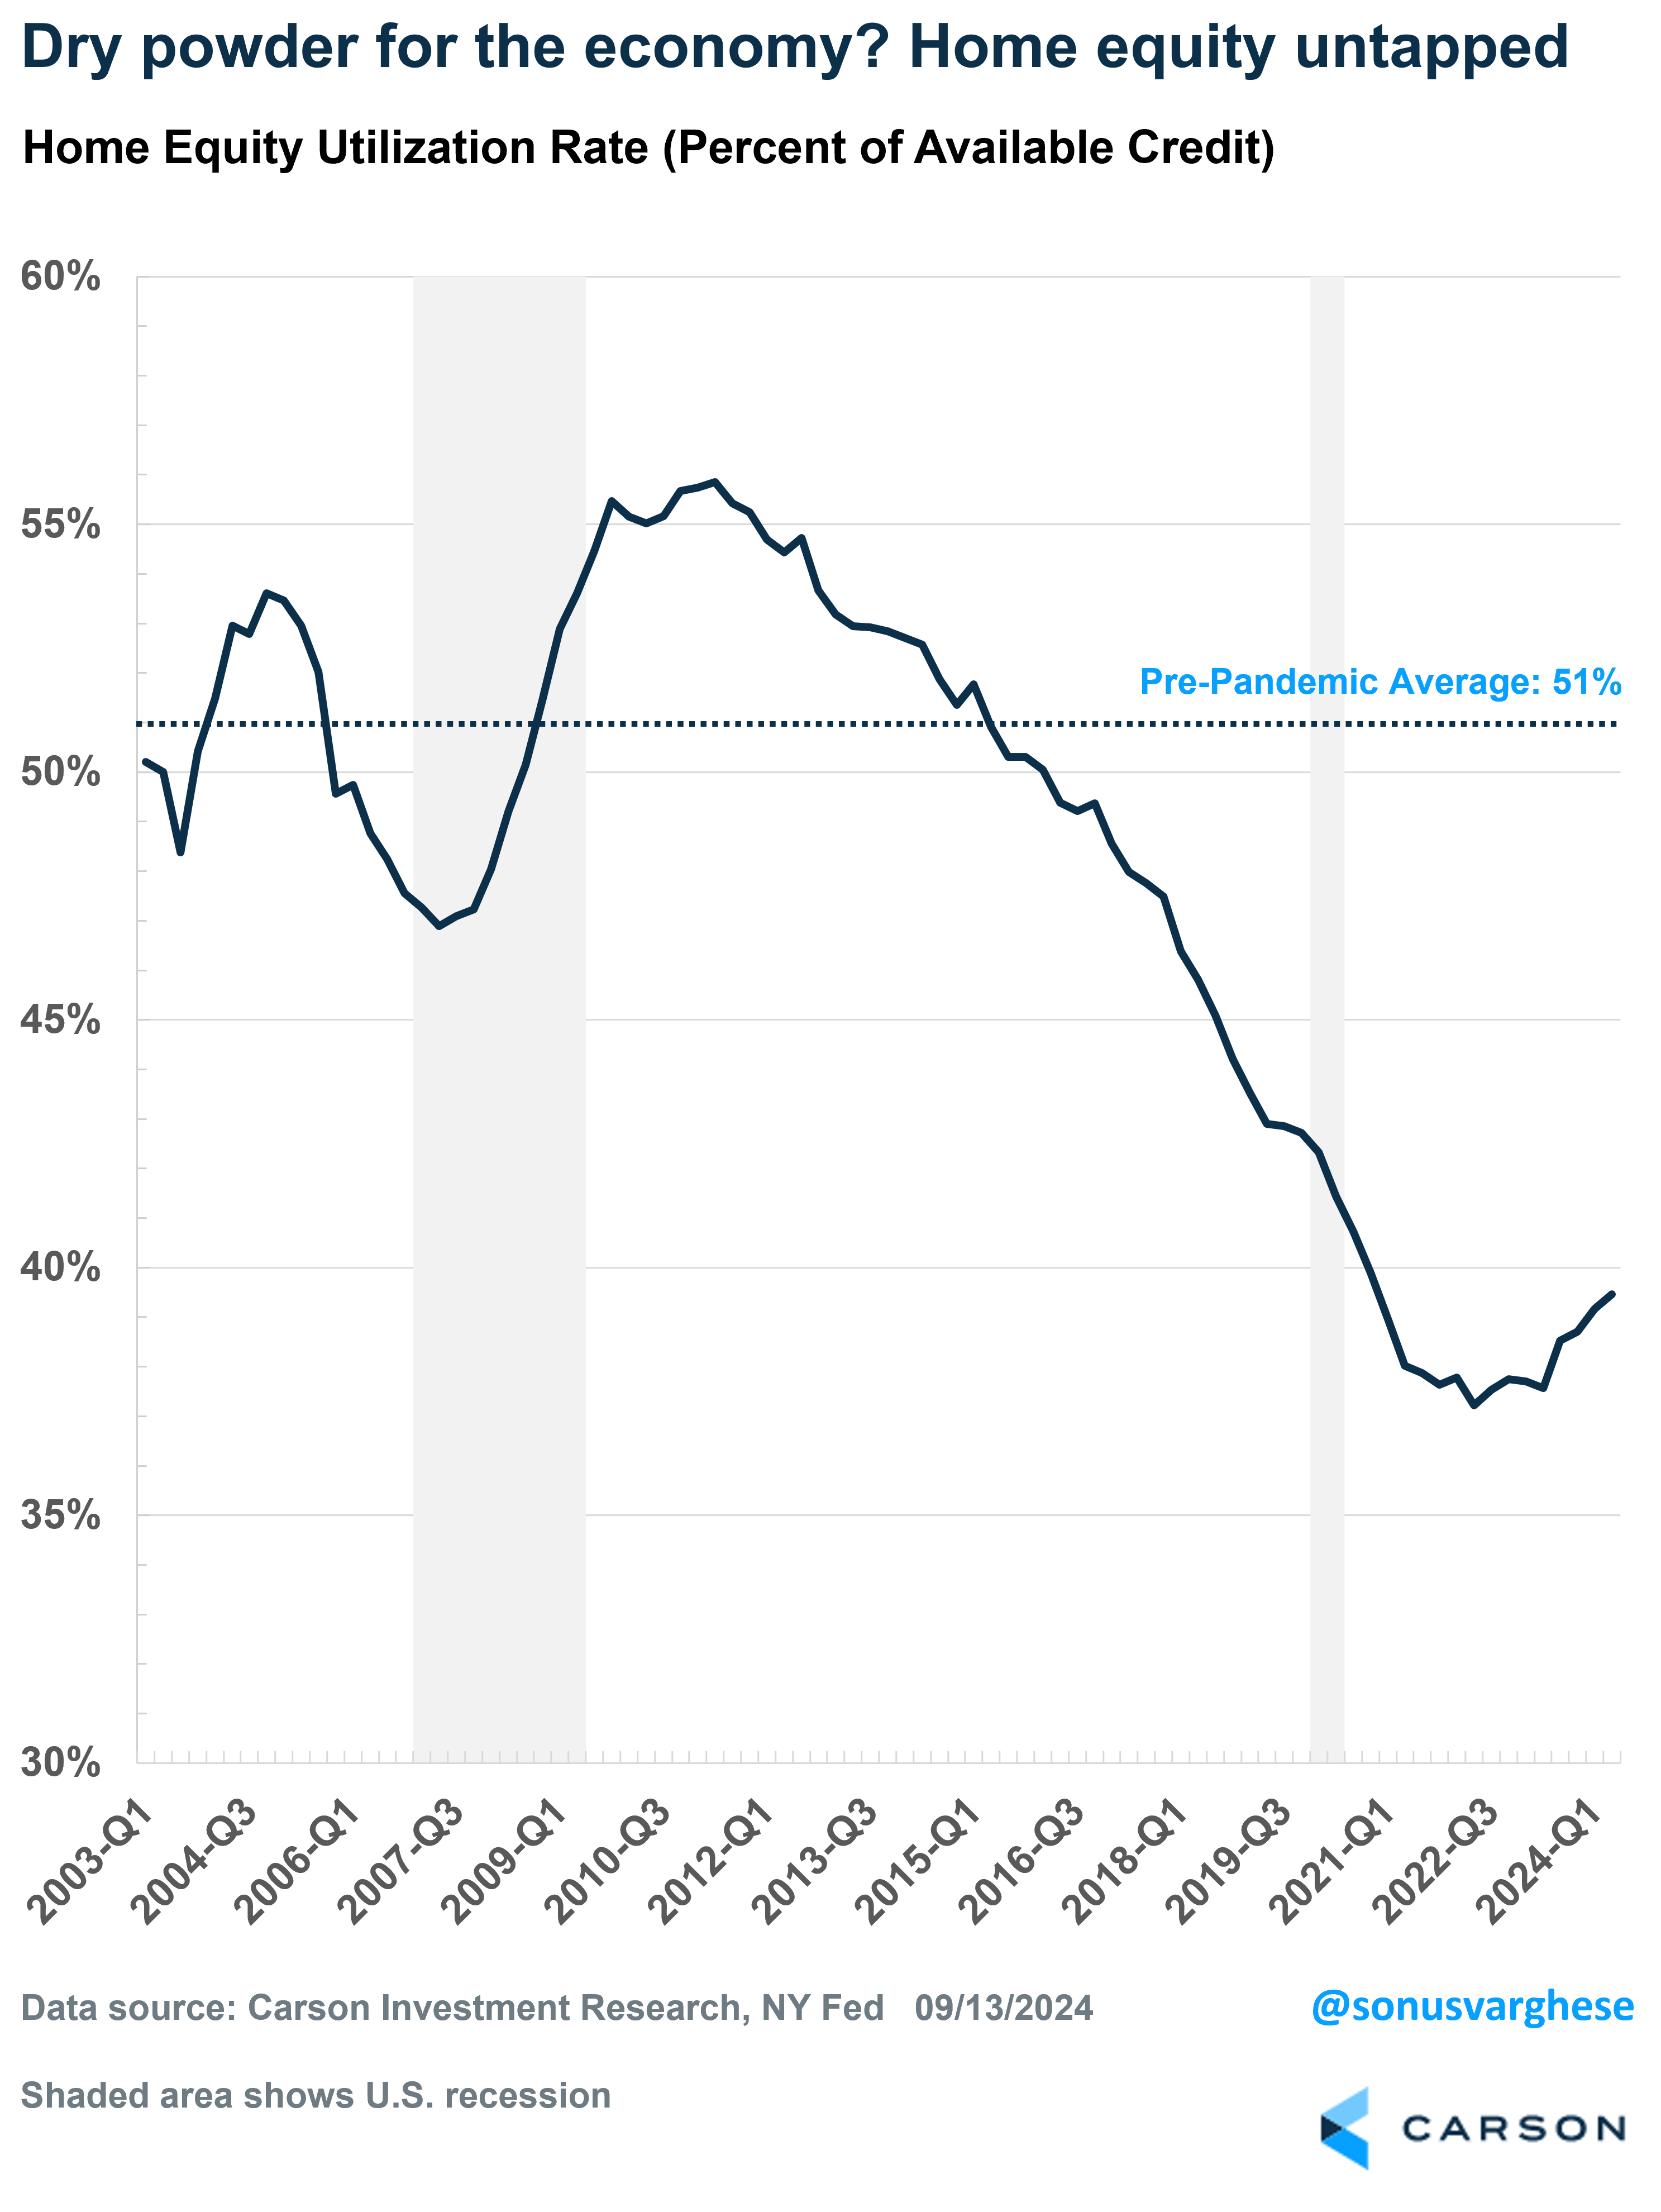
Take HELOCs for example. Households are barely tapping into their home equity lines of credit right now — understandably, because while home prices have risen, interest rates are really high. Home equity “utilization rates” (which is the percent of home equity lines that have been accessed) are below 40%, well below the pre-pandemic average of 51%. Even for those homeowners who currently have a home equity loan, their rates immediately see a drop as the Fed cuts policy rates, which means more of their monthly payments will be going towards paying off principal, thereby improving their household balance sheets. This becomes real dry powder for the economy if lower rates prompt homeowners to start tapping into their home equity and increase spending as a result.
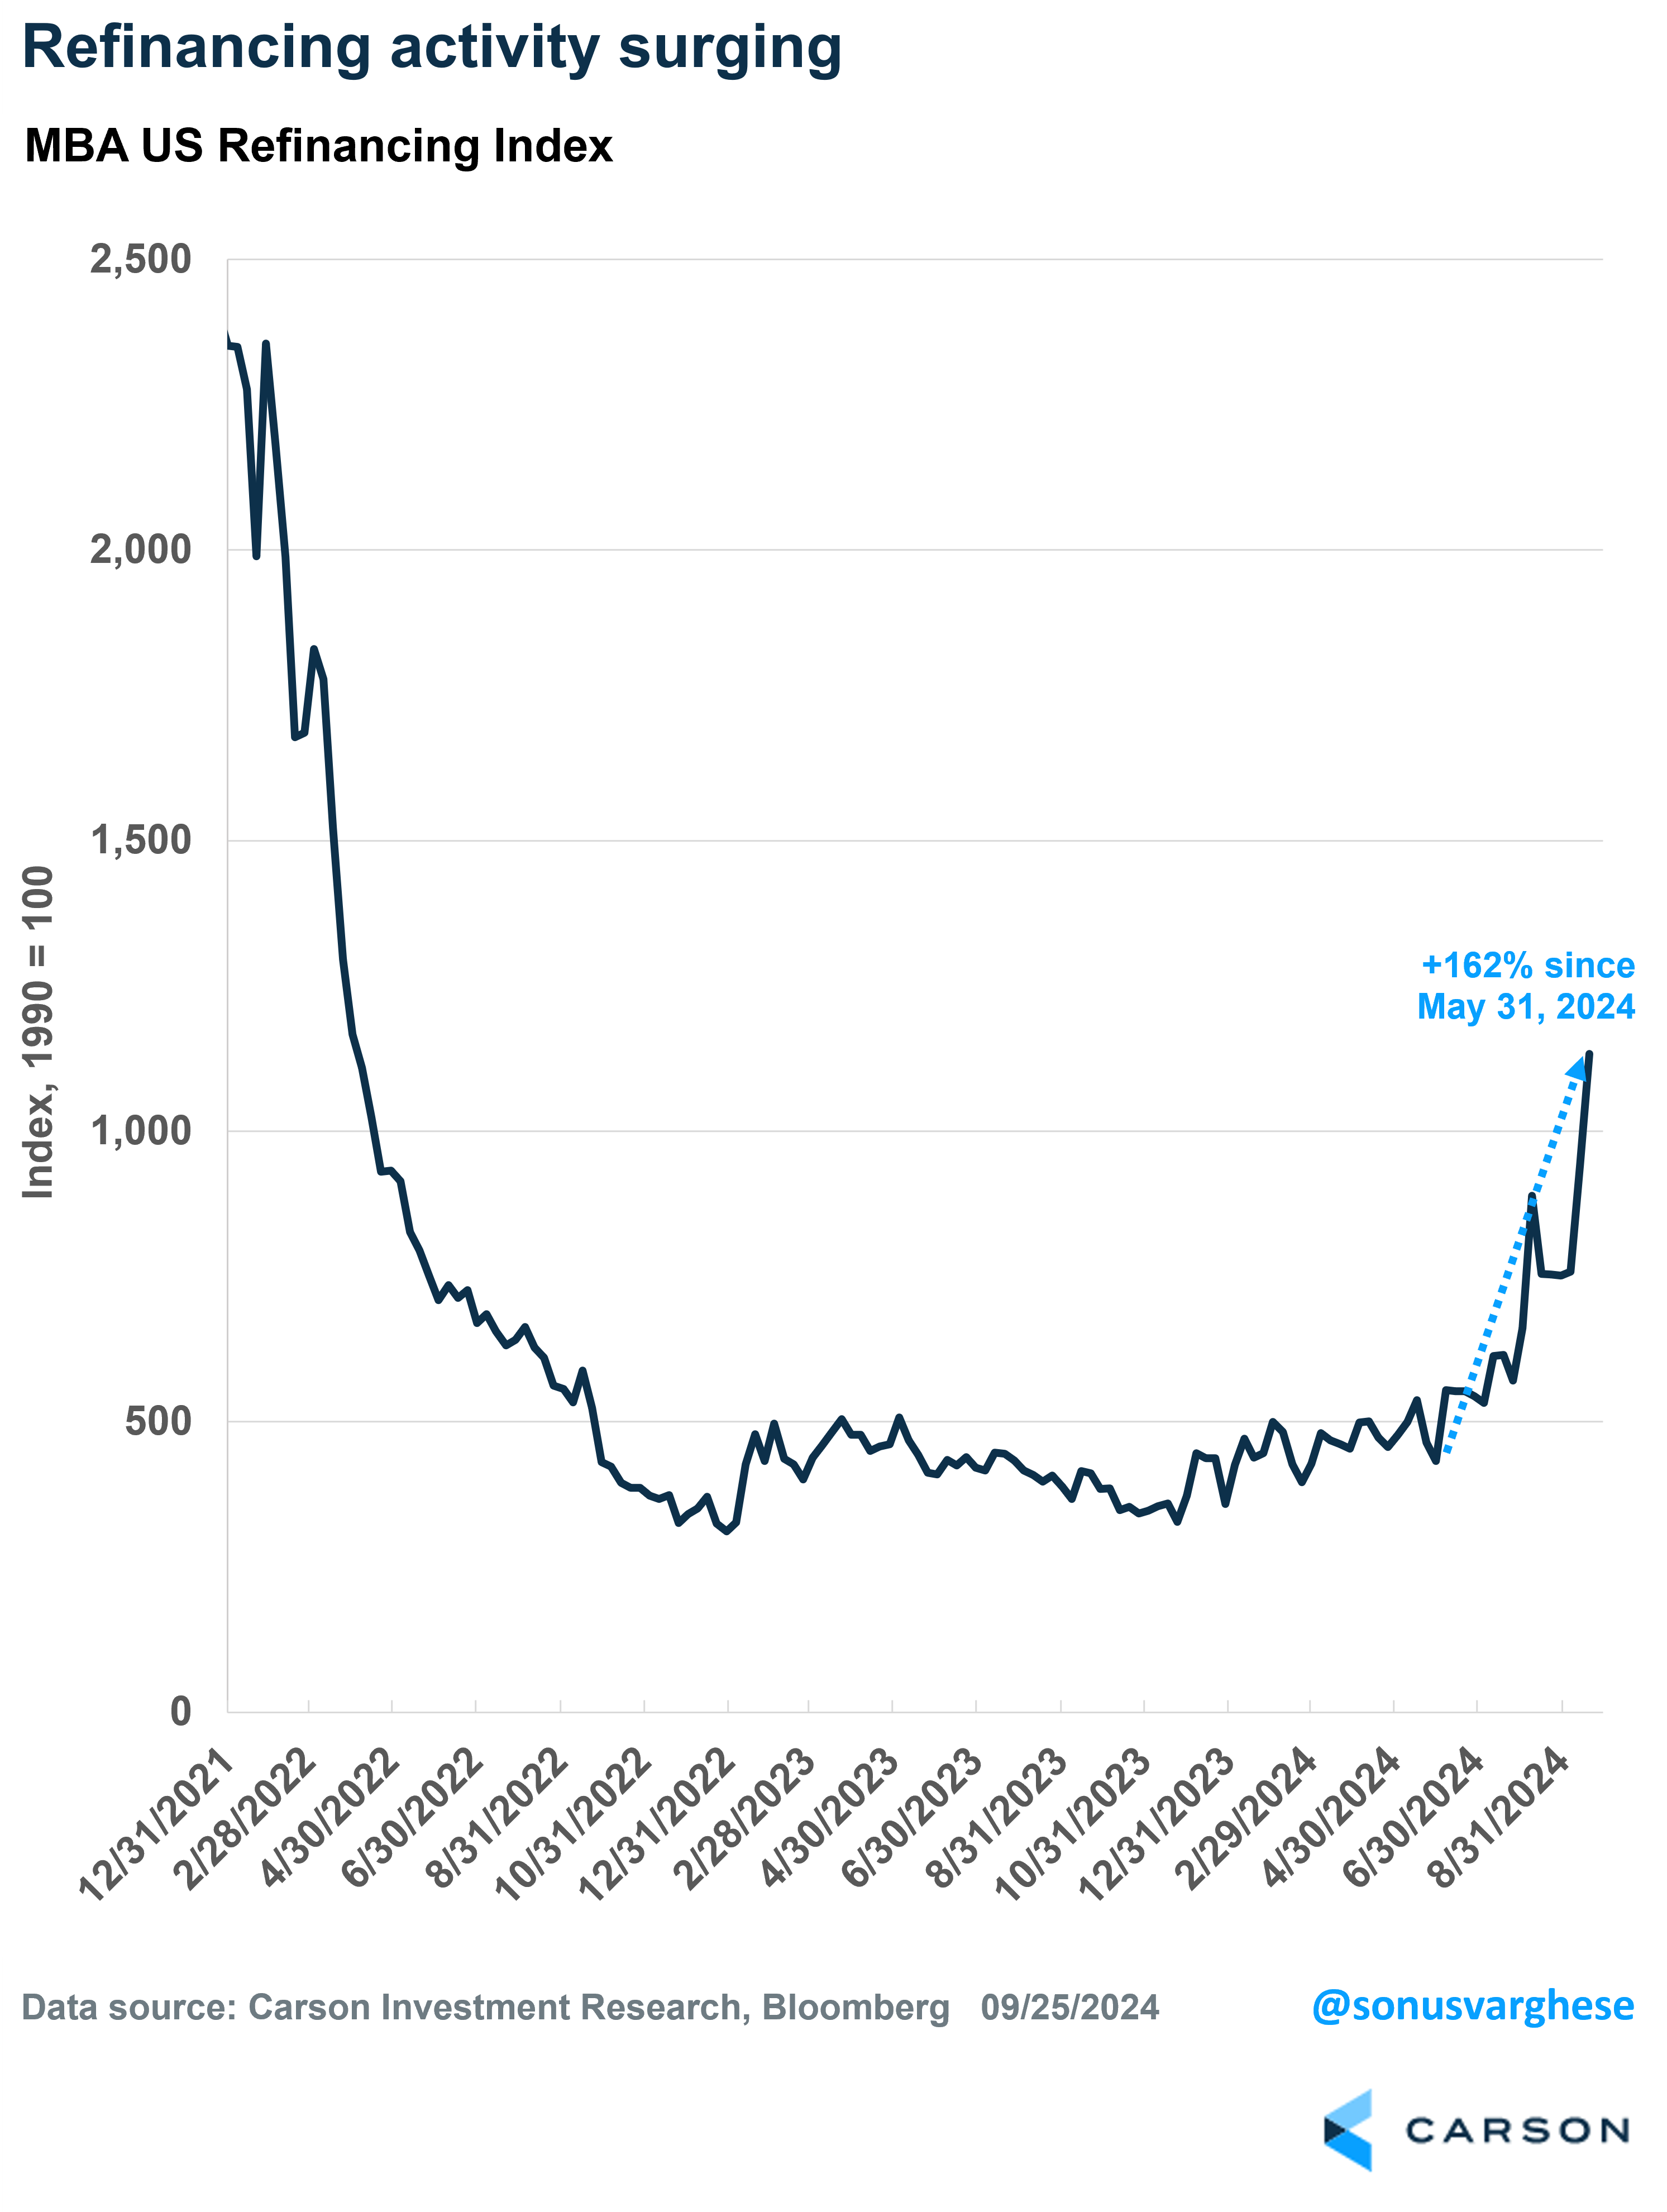
Another area: refinancings, which have been surging recently. The MBA Mortgage Refinance Index has risen by a whopping 162% since the end of May. Mortgage rates started to ease then, and really moved lower over the last 6 weeks. Refinancing activity is still well below early 2022 levels, and so there’s a long way to go. Also, as Parker Ross (Global Chief Economist at Arch Capital) notes, there’s only a relatively small percentage of homeowners who benefit from mortgage rates near 6%. These are folks who bought homes with mortgages well above 6.5% or so, and there just aren’t too many of them. We’re going to have to see mortgage rates get closer to 5% for a lot more homeowners to benefit. In any case, refinancing allows homeowners to access home equity and lower monthly payments, and perhaps drives things like additional home improvements. More money in their pockets = more dry powder for the economy.
One thing that may run counter to the above is a potential rise in effective mortgage rates. On balance, lower mortgage rates can unlock more housing activity, as more homeowners decide to move (finally). However, most homeowners currently have a really low mortgage rate. The average effective rate on outstanding mortgage debt is 3.9%.
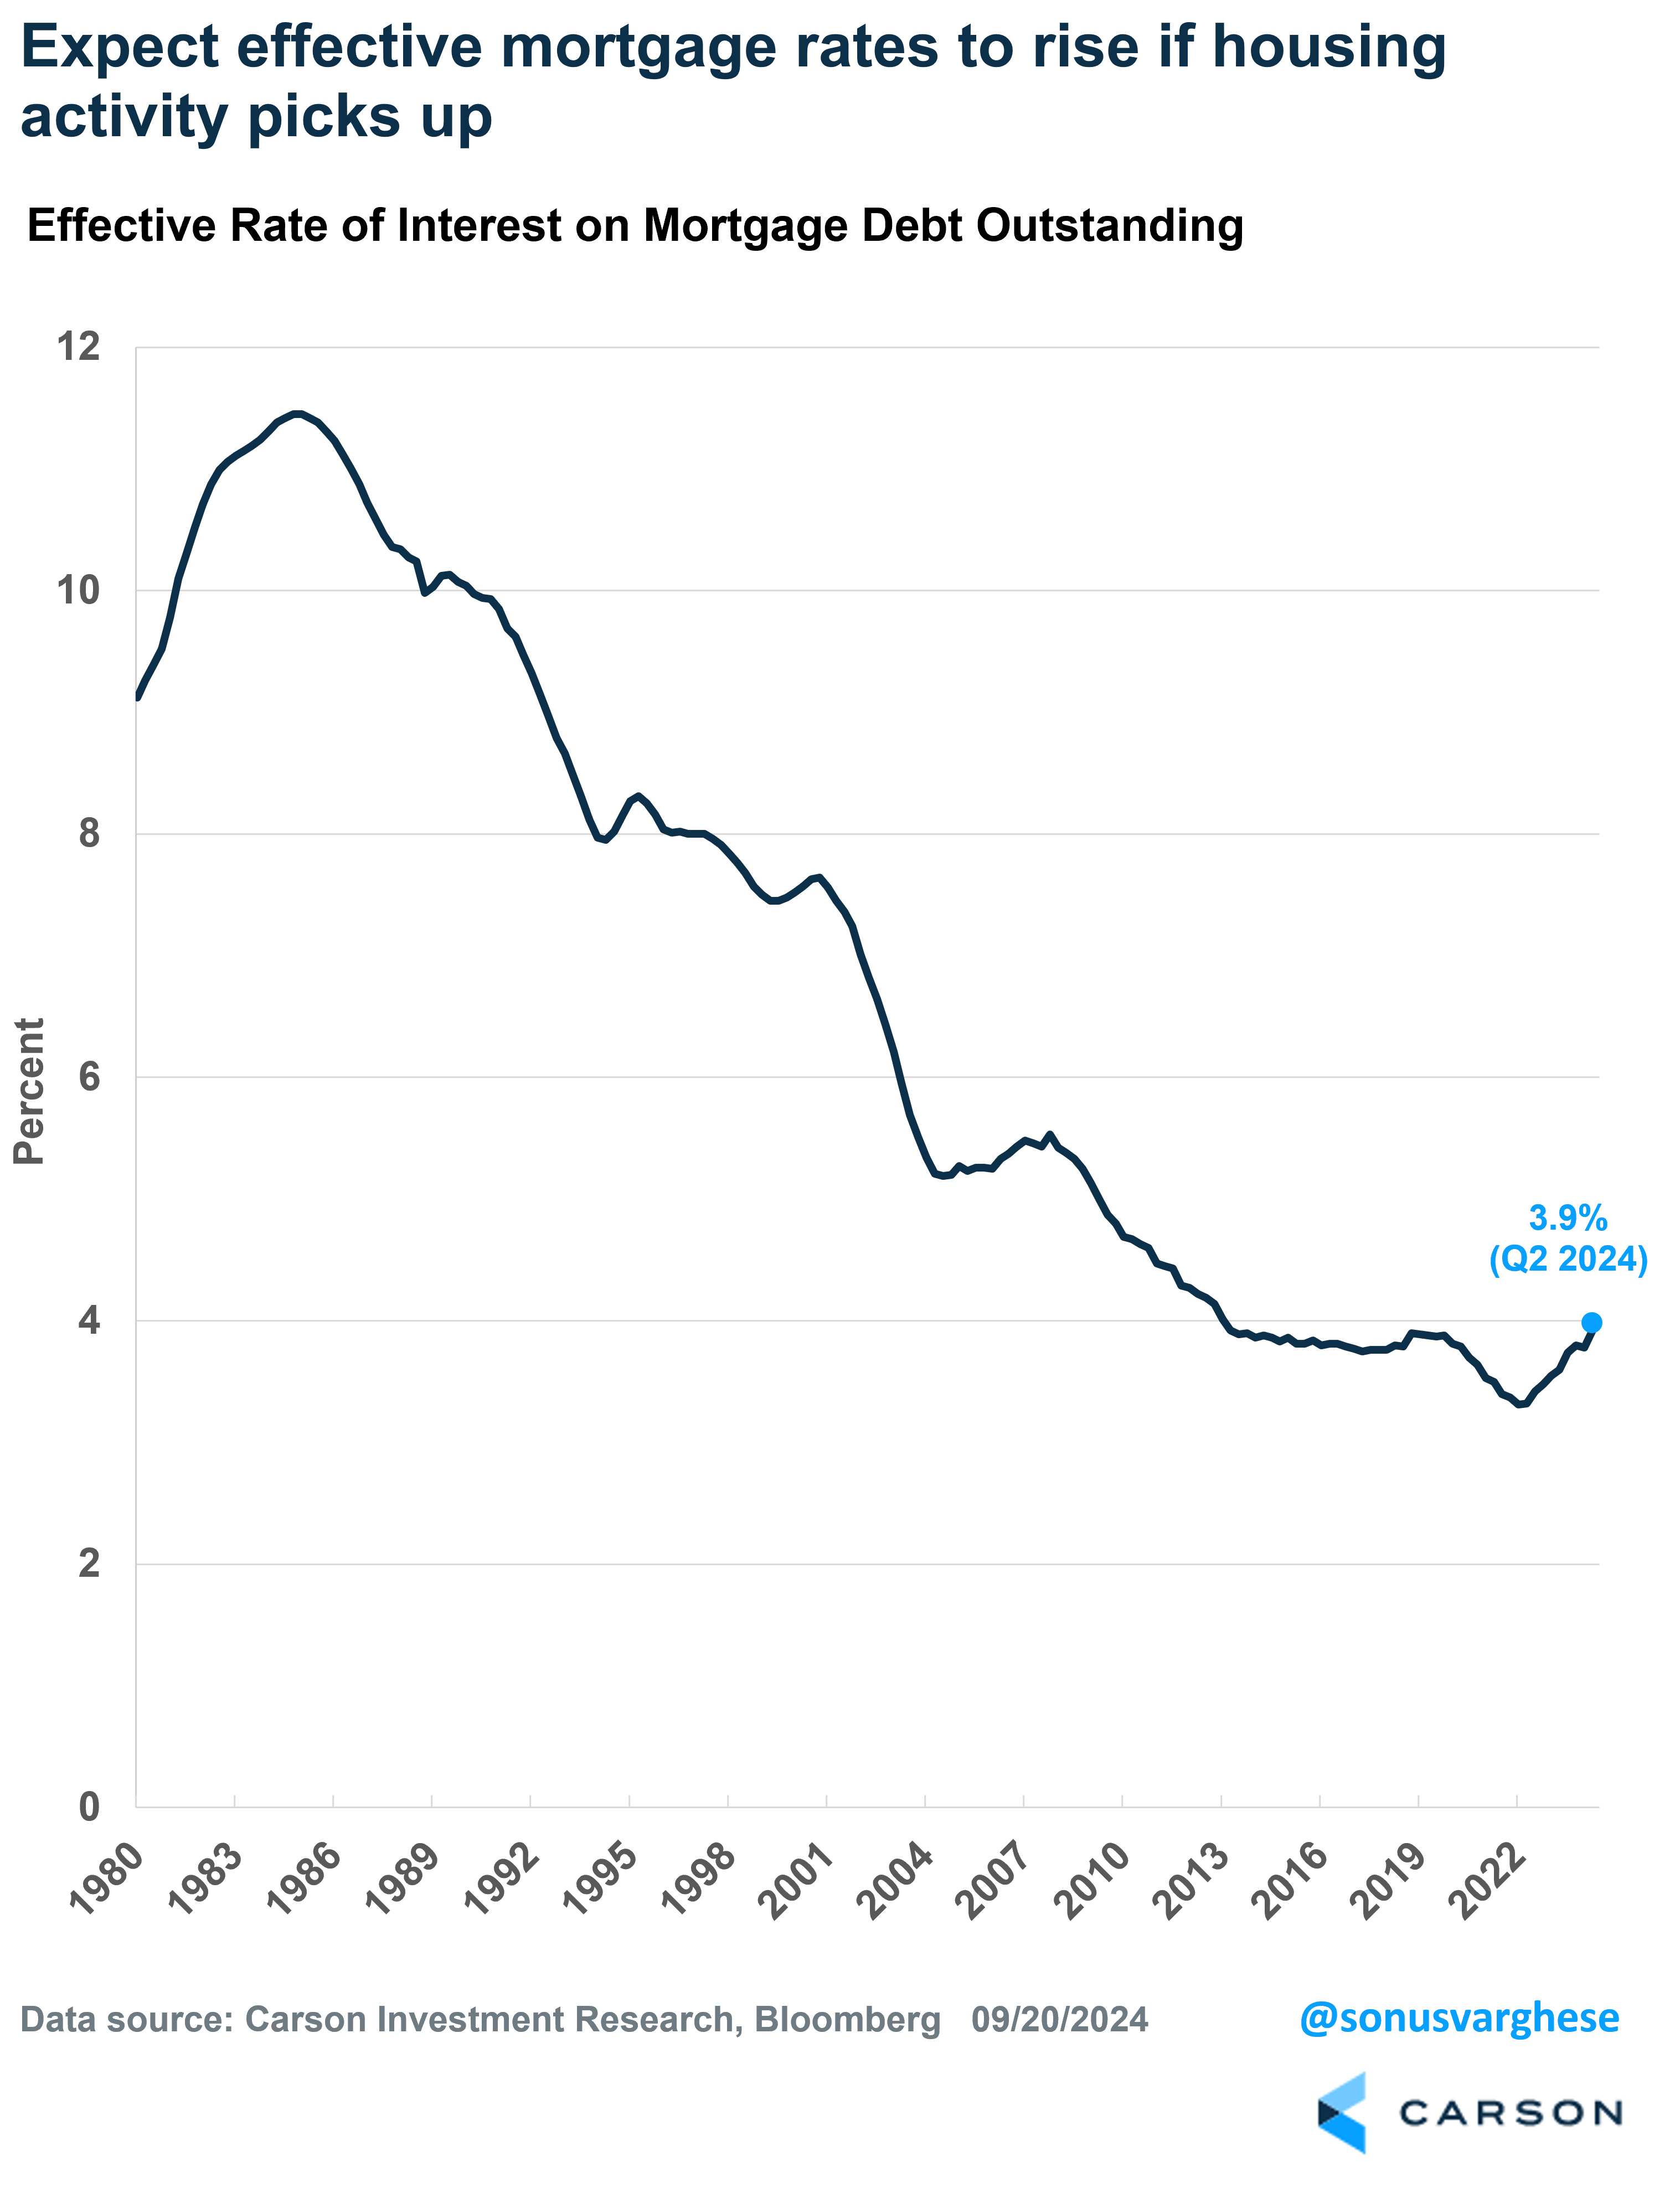
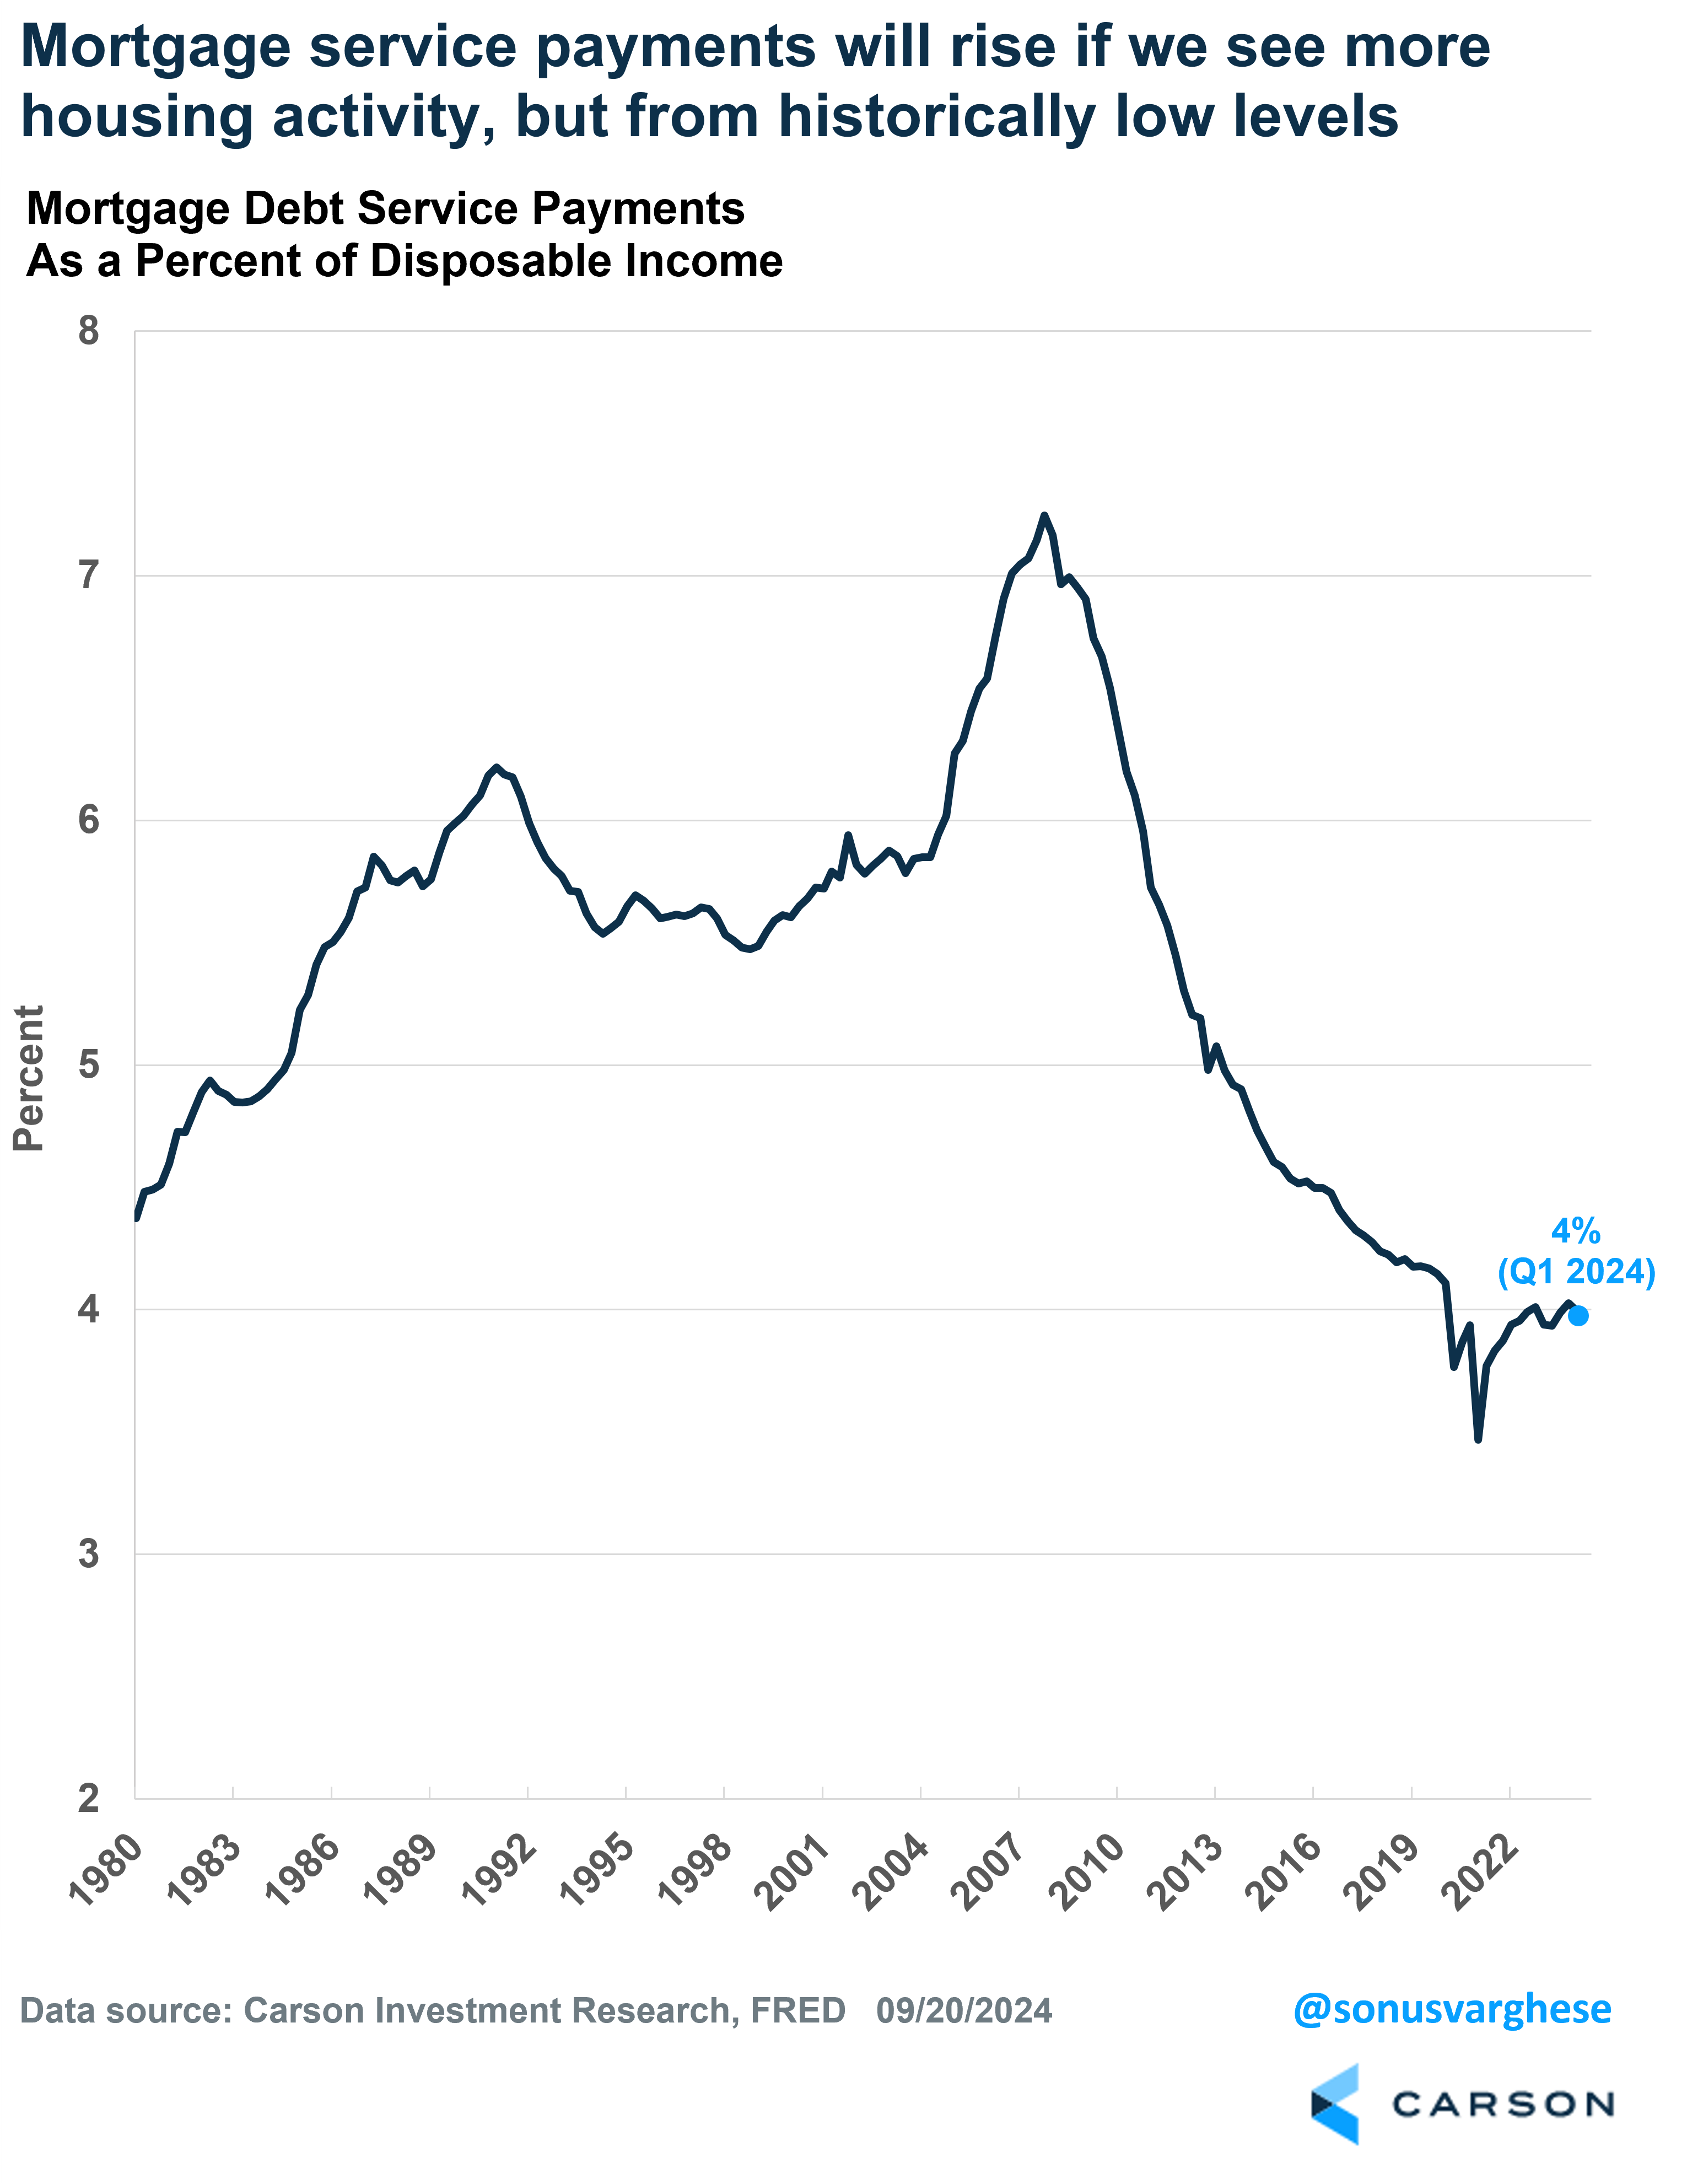
But say mortgage rates pull back to 5-6%. As more households swap out of their homes for a new one, we’ll see the average rate start to increase. Now, homeowners do have more equity as well, because of rising home prices (though the home they buy will also be more expensive). Anyway, we’re potentially looking at monthly mortgage payments taking a larger share of monthly income, though I do want to point out that current mortgage debt service payments are just 4% of disposable income, which is below the historical average of 5.5%. That means there’s room within household budgets to absorb higher mortgage payments, as household wealth and incomes have risen. Of course, on balance, we’ll take more housing activity than not.
All in all, the real “dry powder” for the economy is sitting on household balance sheets in the form of equity. And that could start getting unlocked as interest rates fall, driving economic activity and profits. The odds of that boosting the market (via profit growth) are higher than cash sitting in money market funds moving into the stock market. As I said at the top, the buyer gets cash at that point—it doesn’t just disappear.
For more content by Sonu Varghese, VP, Global Macro Strategist click here.
02430223-924-A