
“Everybody in the world is a long-term investor … until the market goes down.” Peter Lynch, famous fund manager
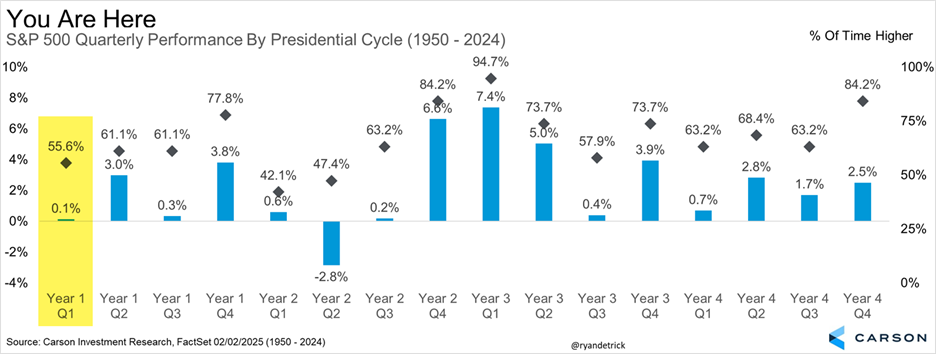
After another big down day on Thursday, stocks officially fell into a correction, with the S&P 500 down more than 10% from the February 19th peak. Although this hasn’t been fun, we can’t say it wasn’t totally unexpected, as late February to early March is one of the more seasonally weak times of the year, not to mention the first quarter of a post-election year is one of the weakest quarters in the four-year presidential cycle. Here’s a chart we’ve shared a lot that shows just this. Then factor in that the first quarter after a 20% gain tends to be weak and that the past 20 years the first quarter has been weak in general, and things were ripe for some volatility early in 2025.
We’ve been on record that at some point this year we’d probably see a 10% correction and here it is. No, I didn’t think it would happen this quickly, but always remember that stocks take the escalator up, but the elevator down.
Another popular chart we’ve shared a lot is how 10% corrections tend to happen once a year on average (shout out to Ned Davis Research for this data). Given we didn’t have a correction last year, you could say the odds favored having one this year.

Is This Normal?
Trust me, I get it. This doesn’t feel normal. We are in the middle of a seemingly escalating trade war with uncertainty dominating everything. Markets can take good news, they can even take bad news, but they hate uncertainty and we have a lot of it.
Still, over the past 46 years this is now the 24th year with at least one correction at some point during the year, meaning these corrections happen a lot. Of course, not all corrections become bear markets. I found 16 years stocks had a correction, but didn’t fall into a bear market that year (which is what we expect to happen this time), and stocks gained a solid 9.5% for the year and were higher for the year 10 times in those cases. Remember that since 1950 stocks are up 9.5% on average.
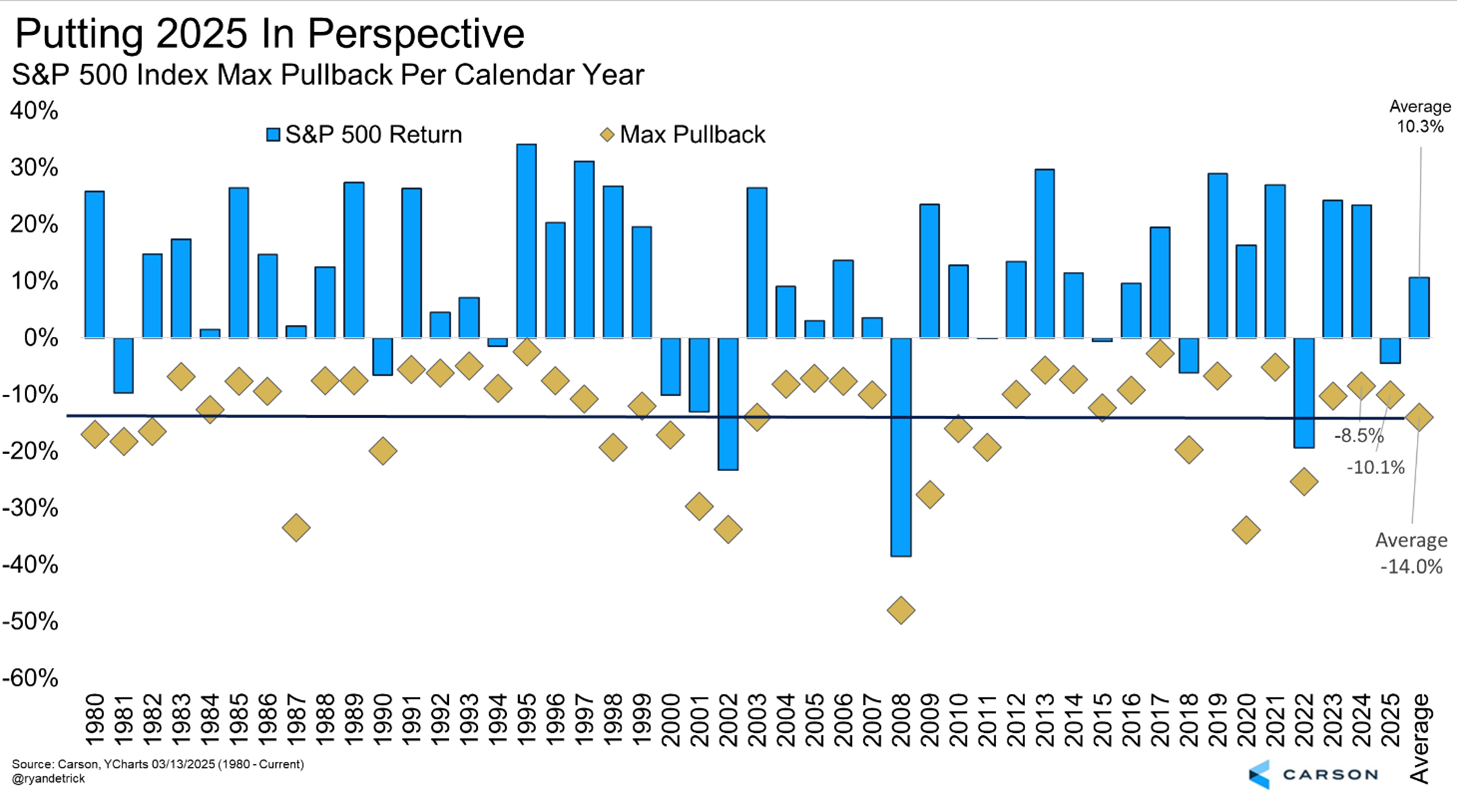
A little more color on the chart above. The average year sees a 14.0% peak-to-trough correction and the years that have fallen 10% at some point, but finished the year higher, ended up with a 17.5% average return for the year. With the S&P 500 down 6.1% for the year, there’s still time for it to get back to positive and maybe even by a large amount. Don’t give up hope just yet.
Could This Turn Into a Bear Market?
Of course anything is possible, but as of now we’d put the odds of this turning into a bear market (so down 20% from the February 19th peak) quite low. First off, we found there have been 48 corrections in history and only 12 of them turned into a bear market, so only 25% have gone on to move into bear market territory.

Another Bear Would Be Quite Rare Part 2
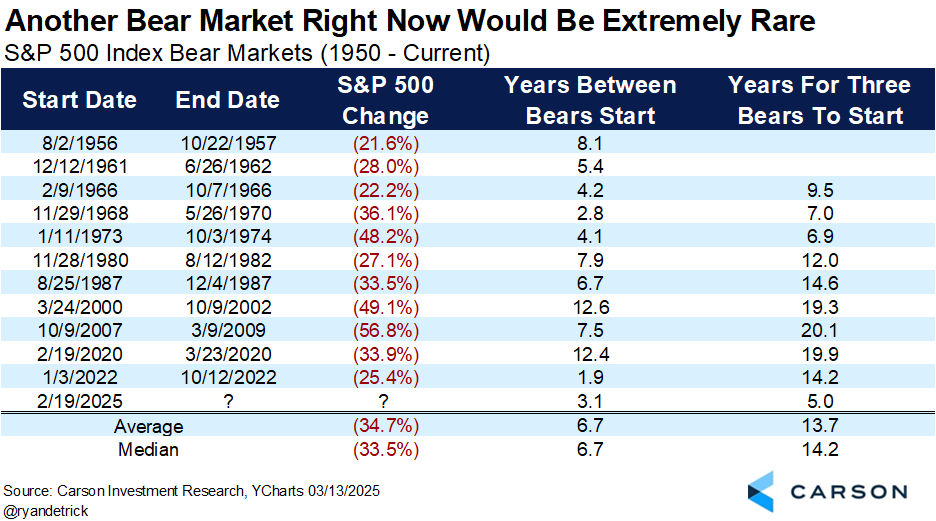
If this turned into another bear market it would set a new record and I guess this would be under the “records we don’t want” category.
The S&P 500 peaked on February 19, 2020 before the Covid bear market and then we had another bear market in 2022. We’ve never seen back-to-back bears so close (only 1.9 years apart), so could we really have a third bear so soon? If we did that would be three bear markets starting within five years of each other, breaking the previous record of nearly seven years between 1966 and 1973. Again, anything is possible, but I’d say another bear this soon after the previous two isn’t a likely scenario.
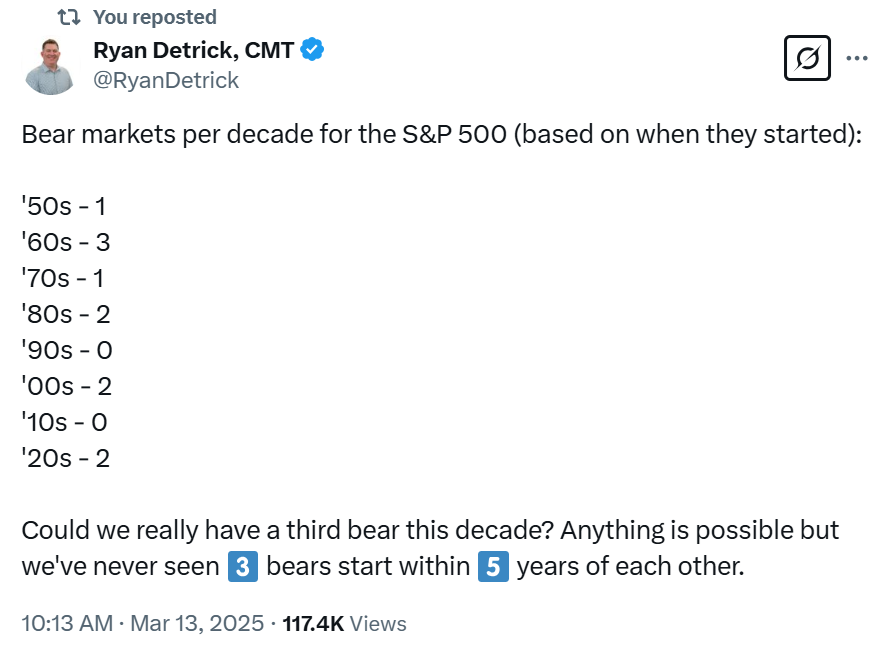
Here’s a tweet I did on how many bear markets we’ve seen per decade. Again, could we really have three bears in only half a decade?
What Are We Doing?
Remember, our team doesn’t just write or talk about what is happening, we manage real money for our Carson Partners. The majority of our models have done extremely well the past few years, mainly due to our large overweight to equities. We are still overweight equities now, but we’ve been making changes since late last year to help prepare for a year that was likely going to be a tad more volatile than the past two.
If you are all in the “Magnificent 7,” yes, this has been quite rough, but if you have a well-diversified portfolio it isn’t nearly as bad as they keep telling you on TV.
Here and now we are preaching to stay diversified. Yes, the S&P 500 is down more than 6% for the year, but core bonds are up a couple percent, long Treasuries are up close to 4%, gold is up double digits, and most European market are up in the upper teens or more.
Stay on Top of Market Trends
The Carson Investment Research newsletter offers up-to-date market news, analysis and insights. Subscribe today!
"*" indicates required fields
We have exposure to all of these areas to help with this kind of volatility. We added gold in our tactical models as far back as March 2023, then added more after the big gold drop after the US Election in 2024, while we finally added some Treasuries late last year and added Treasury inflation-protected securities (TIPS) about a month ago. We have an allocation to international stocks and are actively considering whether we should add a little more. Yes, small caps have been quite disappointing, but we’ve been in both small and midcaps (what we call SMID) and midcaps have done a tad better than small caps. We won’t get them all right and will certainly have our share of incorrect calls, but the good investors are those who keep those mistakes small.
I joined CNBC Power Lunch earlier this week to discuss many of these concepts and you can watch the full interview below. Thanks for reading!
For more content by Ryan Detrick, Chief Market Strategist click here.
7744977-0325-A