
Have you heard? This is a tight election and it’s going down to the wire. Election Day is now five days away but an estimated 58.4 million ballots have already been cast, or more than 1/3 of the total votes cast in 2020. We would still call the presidential race a near coin toss, although polling has improved slightly for former president Trump over the last month.
While we may know the results Tuesday night, it’s likely that we’ll have to wait a little longer. We understand the election isn’t really decided until the electoral college meets on January 6, but given our market focus, “decided” for us is controlled by when markets price in a near certainty of one candidate or the other winning, and that aligns closely with when a consensus of major news outlets call the election. In fact, that’s a little late — markets will actually start pricing in likely outcomes much earlier. Still, the media call will roughly correspond to the point when the outcome is fully priced in.
Someone did once ask me, “Since when do major news outlets call the election?” Well, obviously the media has no constitutional role in the outcome, but the Associated Press (AP) has been calling elections since 1848 when telegraph networks started giving them much faster, more accurate data than what was otherwise easily available. While the technology has changed, the reasoning is similar. Of course, it’s possible for the media to be wrong or for litigation to shift an election. That could stress the market, although even that we would think unlikely.
Stay on Top of Market Trends
The Carson Investment Research newsletter offers up-to-date market news, analysis and insights. Subscribe today!
"*" indicates required fields
This election is so close that we probably won’t know the result on election night. Call it maybe a 1 in 3 chance that systematic polling error is large enough in one direction or the other that the outcome becomes clear relatively quickly. (That is, by Wednesday morning.)
We don’t have a lot of points for comparison for delayed clarity, but in 2020 the Associated Press called the election a little before noon on the Saturday after the election. In 2016, also a fairly close election, AP called it at about 2:30 a.m. on Wednesday morning. In 2000, the election wasn’t resolved until the Supreme Court ended the recount process in Florida on December 12, 35 calendar days and 24 market trading days after election day. Even with the prospect of recounts and litigation, based on election history it’s likely we’ll know the outcome by the weekend following the election.
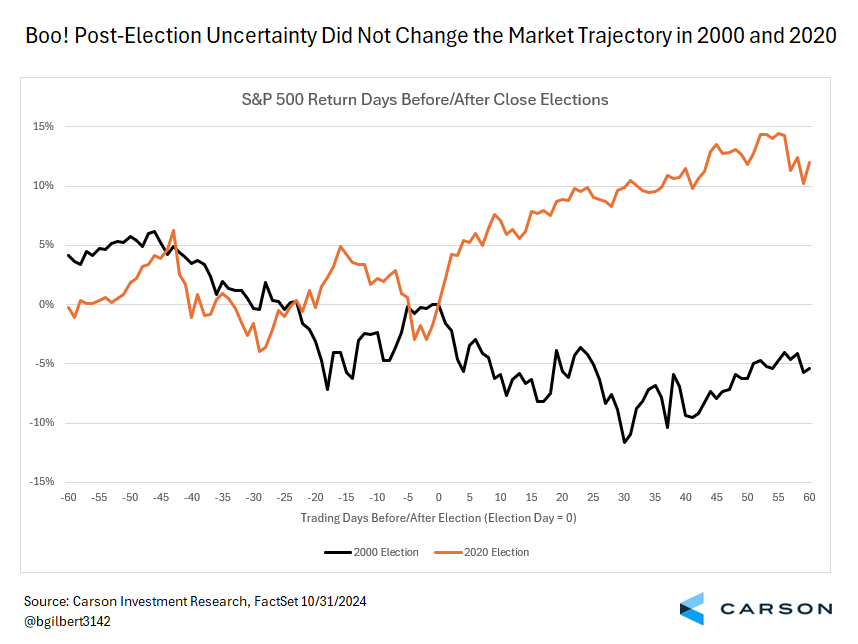
How might the market react to uncertainty? Well, when it comes to the known uncertainty, not at all really. Above we map out our small sample of 2000 and 2020, when AP’s election call didn’t take place on the evening of the election or the wee hours of the following moring. In 2000, we were already in a bear market and we did see further declines. By December 12, the day of the Supreme Court decision, the S&P 500 had fallen more than 6% since election day. But it went on to fall an additional 4% over the next two weeks, signaling the decline was not due to election uncertainty.
In 2020, the S&P 500 climbed 4% during the three days of uncertainty following the election, showing relative indifference to how close the result was. Our takeaway? We already know the outcome might be delayed, and expected uncertainty or even more extended uncertainty as part of a relatively orderly process of recounts and litigation is unlikely to faze markets. Even in the unlikely case of more extreme uncertainty, markets are likely to take it in stride. Anything that looks likely to resolve in a reasonable timeframe probably won’t be disruptive. Markets look past global geopolitical events relatively quickly and we don’t expect the election to be different. There may be events at the margin that would lead markets to fret, but we would view these as quite unlikely.
Are You More Miserable Today Than You Were Four Years Ago?
In a recent blog, 16 Charts (and Tables) to Know This Year Revisited, I reviewed some of our favorite election-related charts that we first shared back in March. The end of that blog had two election “forecasters.” These two simple traditional signals of US prosperity, absence of a recession in the prior two years and stock market performance, suggest a solid result for Vice President Kamala Harris Tuesday. On the other hand, former president Donald Trump has a slight lead in swing state polling and therefore in most forecast models.
As I said above, we would still consider the presidential race a near coin toss and these signals don’t change our view. While the absence of a recession (in fact, the economy has been humming along nicely) and the strength of the stock market are positive, they are also simplistic. Our bottom line take? You can play around with the numbers all you want, but in the end, voters choose the president, not polls, models, or the stock market. We continue to encourage all our readers to vote, no matter how you might choose to cast your ballot — that’s what decides elections.
Today I thought I would add to the mix by looking at the “Misery Index.” The Misery Index combines two traditional measures of potential consumer misery, the unemployment rate and inflation (trailing year Consumer Price Index), into a single number by simply adding them together. Because economic data always lags, the most recent common data point we have for both numbers is for September. (We’ll get October unemployment data tomorrow.) The below chart looks at the September measure of the Misery Index for every election year since 1952 as well as the four-year change. (There will be some rounding error in there.)
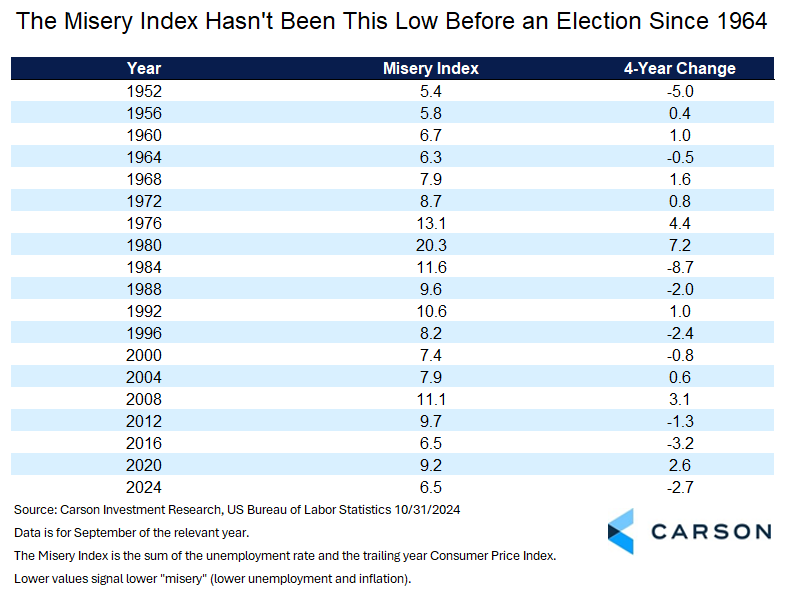
The current value of the Misery Index is in the 20th percentile of all values of available data (inception 1948), which is very good. It’s also the lowest of any preelection value since 1964 and significantly better than where we were four years ago. Clearly, that’s not aligned with broad economic sentiment. See, for example, the University of Michigan’s survey of consumer sentiment, which has been improving but remains relatively low. So what gives? A few thoughts…
- 2020 was an anomalous year (to say the least) and even Trump’s fiercest critics cannot blame him for the spike in unemployment.
- On the other hand, while inflation has normalized, prices themselves don’t fall, so the perception of high prices, compared to the current normal level of inflation, may have staying power in the national consciousness.
- That said, inflation was also a global phenomenon, spiking globally despite different policies in different countries.
- Most important, perhaps, this is a fairly narrow indicator and ultimately it is up to voters to decide the state of American prosperity.
The main takeaway from the Misery Index, further confirmed by yesterday’s GDP data, is just that the economy continues to do pretty well. There still may be areas of the economy that are a major concern for many voters. We just can’t include employment and inflation among them. Or the presence of a recession in the last two years. Or the stock market. But that still leaves plenty to potentially focus on.
For more content by Barry Gilbert, VP, Asset Allocation Strategist click here.
02487634-1024-A