It’s not like we needed a lot more proof that the economy is strong. If you listen to the doomsayers, it always seems like the economy is hanging on the edge of a precipice. Never mind the latest GDP report card, which showed the economy grew 3.1% in inflation-adjusted terms in 2023. Of course, it’s one thing to get strong numbers, but it’s even better when the data are strong for the “right reasons.” In this case, the economy is strong because the labor market is strong, which is generating strong income growth that is powering consumption. And consumption makes up close to 70% of the economy. At the end of the day, that’s what matters. Anything else that is trending higher, be it housing or even manufacturing, is all icing on the cake. Oh, and did I mention that inflation is falling too? Which means inflation-adjusted incomes are growing.
Boom Goes Payrolls
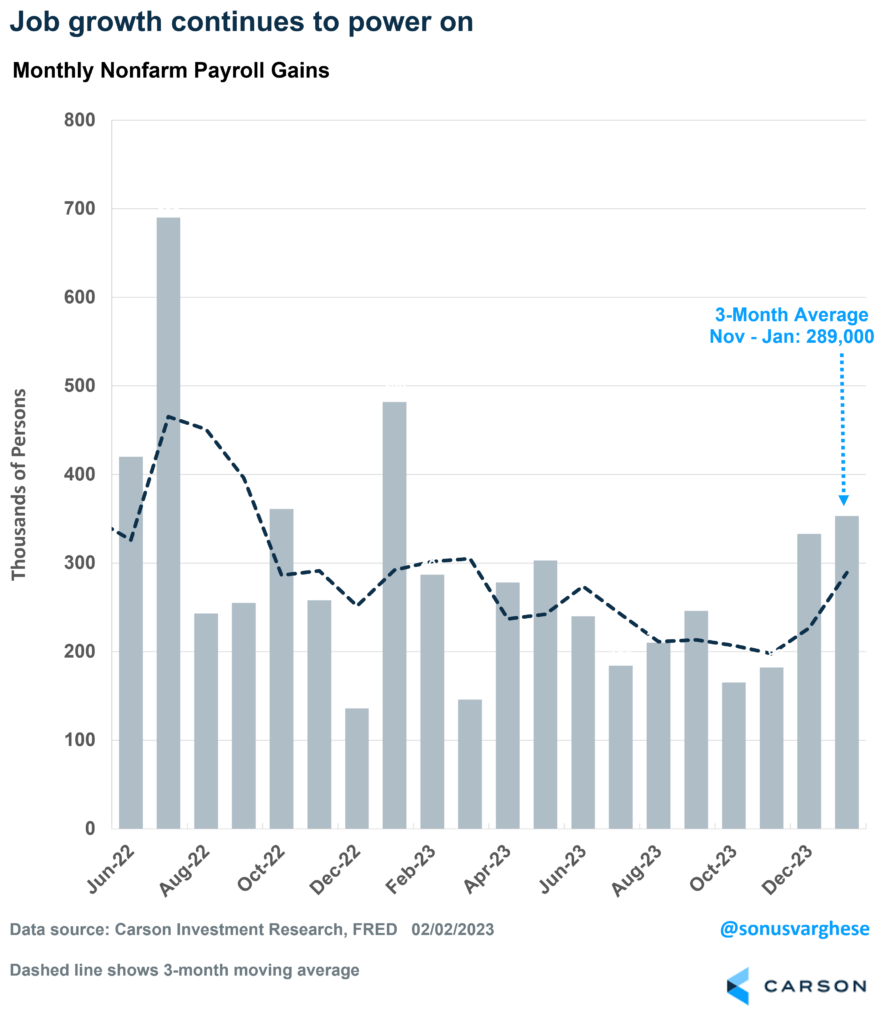
The January payroll report just blew past expectations. The economy created a whopping 353,000 jobs in January. Even better, the net job gains in December were revised up from 216,000 to 333,000. So, the economy has averaged job creation of 289,000 per month over the last 3 months. For perspective, the average in 2019 was 163,000. By the way, job creation in 2023 was actually better than originally estimated – across the full year, the economy created just over 3 million net new jobs, versus the prior estimate of 2.7 million.
Here’s icing on the cake if you needed it. Cyclical industries also saw a nice employment pickup in January.
- The construction industry created 11,000 jobs in January, and over the last six months, it’s created a total of 116,000 jobs.
- The manufacturing sector, which is supposedly in a recession if you look at popular surveys, created 23,000 jobs in January, and over the last six months, it’s created a total of 40,000. I’m going to go out on a limb and say that manufacturing is not in a recession!
- Leisure and hospitality, one of the most cyclical areas of the economy, created 11,000 jobs in January, taking the six-month total to 195,000. That’s a strong service sector!
There’s more.
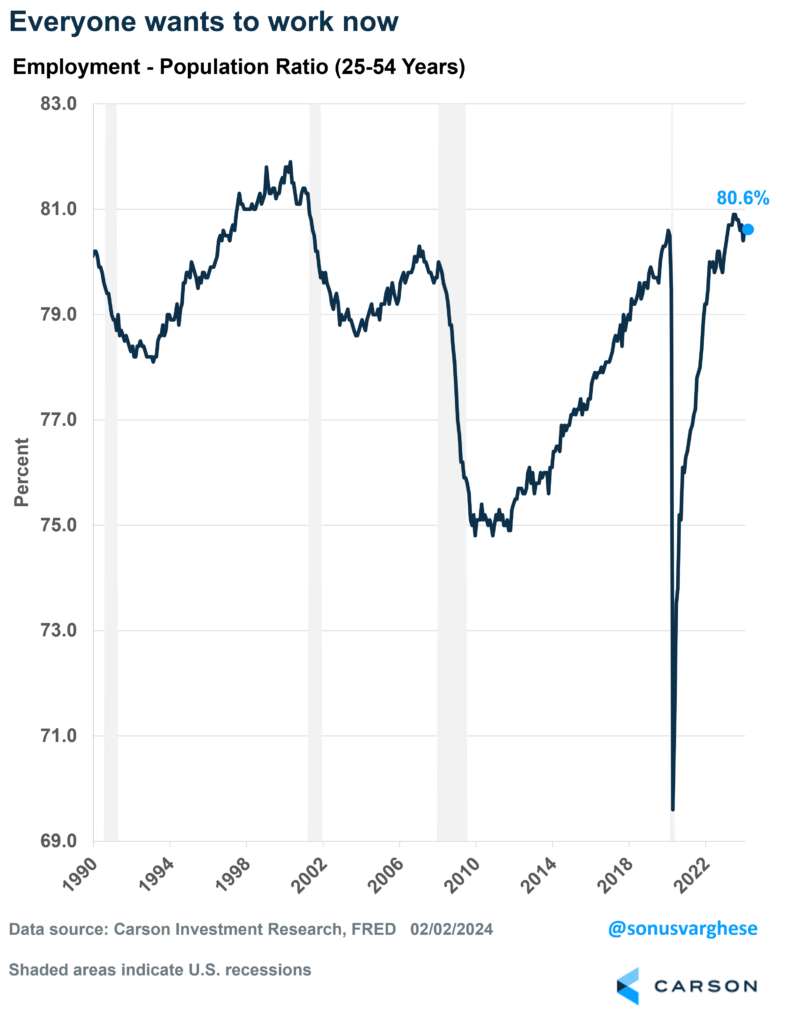
The unemployment rate remained unchanged at 3.7%. I’ve noted in previous blogs that I prefer looking at something called the prime-age employment-population ratio. It measures the number of people age 25-54 that are employed, as a percent of the total number within this cohort that could potentially be employed. It gets around issues like an aging society and definitions of “unemployment” (which counts only people who are “actively looking for work”).
The prime-age employment-population ratio is 80.6%, matching the highest we saw in the last cycle in January 2020, when we thought the economy was in pretty good shape (pre-Covid). It’s not far below the highest level we saw over the past year, when the ratio hit 80.9% last July. It tells us that more people are working, and want to work, than what we’ve seen at any point between 2001 and 2020. In fact, for women, the ratio is at 75%, which is higher than anything we’ve seen in history prior to 2023 (the highest was 75.3% in October 2023).
Income Growth Is Strong, While Inflation Is Running Low
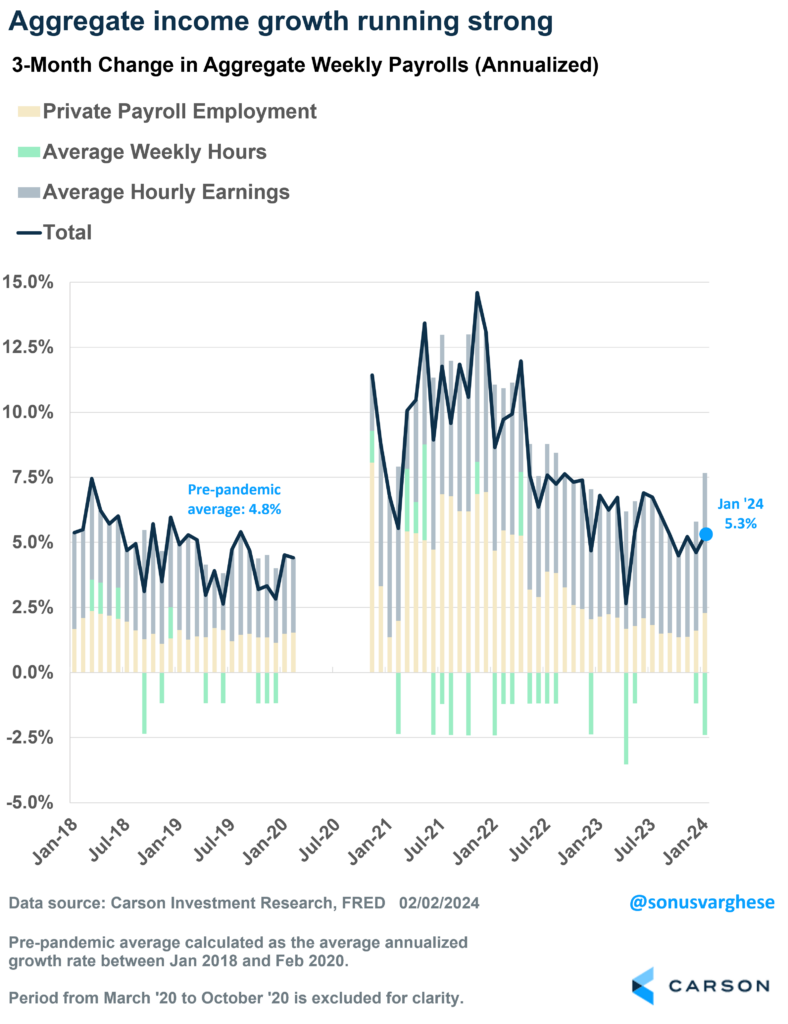
As I pointed out at the top, what matters for consumption is incomes, and over the last three months, income growth across all workers in the economy is running at an annual rate of 5.3%, above the pre-pandemic pace of 4.8% (which was also strong). Aggregate income growth is the sum of
- Employment growth: which is strong
- Wage growth: which is also running strong
- Hours worked: which has normalized, and is actually running slightly below pre-pandemic levels
You can see why income growth is running strong: two of the above three components are running with all engines firing.
On top of that, inflation is also falling, thanks to lower gas prices and other commodity prices. Food prices are also in disinflation, as are several other categories on the services side. Over the last 3 months, headline inflation, as measured by the Fed’s preferred personal consumption expenditure index (PCE), is expected to run close to a 1% annualized rate. (PCE is less prone to being artificially elevated right now due to lagging official rental inflation data.)

Stay on Top of Market Trends
The Carson Investment Research newsletter offers up-to-date market news, analysis and insights. Subscribe today!
"*" indicates required fields
All that implies inflation-adjusted aggregate income growth is running around a whopping 4% annualized pace! In a sense, that’s the potential speed of the economy. Let that sink in.
Up Goes Productivity
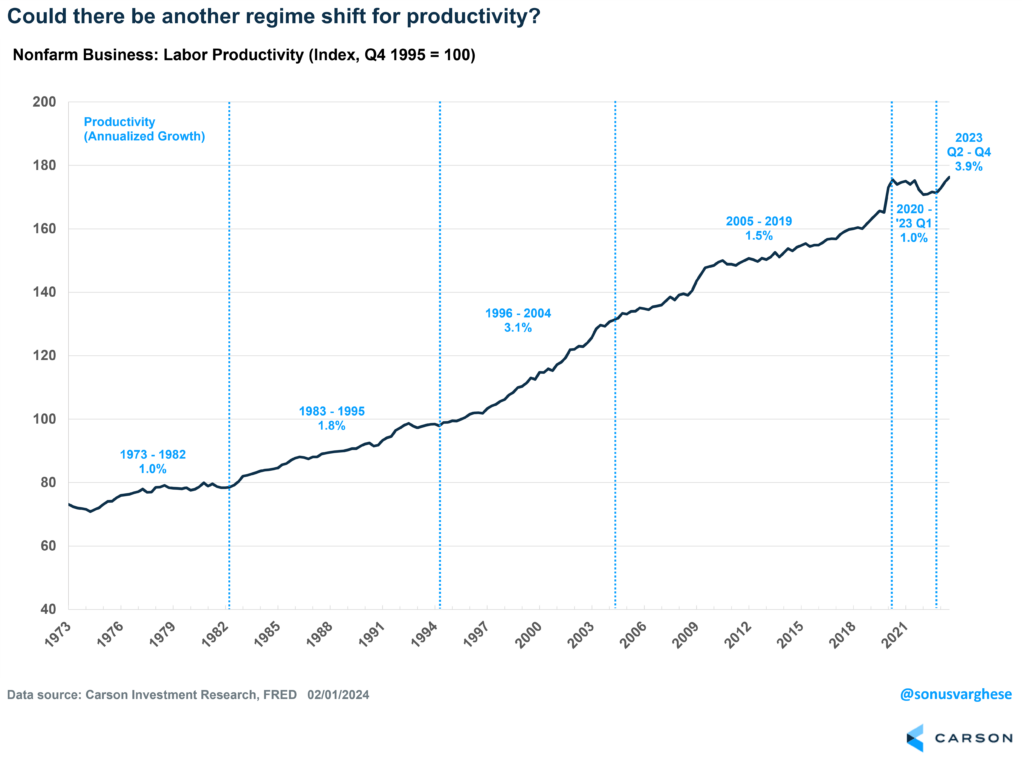
The other important data point we got this week was productivity. Quarterly productivity data can be volatile, but over the last three quarters, productivity has grown at an annual rate of 3.9%! That’s well above the 2005-2019 pace of 1.5%, and right now, it’s clocking higher than what we saw in the late 1990s. As I noted in the previous section, “hours worked” has edged lower recently, but output has increased, i.e. we’re producing more by working a tad less. That’s why productivity is up.
As we wrote in our 2024 Outlook (which you can download here), productivity growth is a potential game changer, if it continues. When productivity growth is strong, workers can see strong wage gains even as inflation remains muted. It allows the Federal Reserve to ease up on interest rates, which can spur business investment and further boost productivity. A key part of this a strong labor market, as that’s ultimately what forces businesses to invest in productivity-boosting technologies. The Fed obviously plays a key role here, but we believe they’ll start cutting rates as early as May or June. That’s another tailwind for the economy.
Ryan and I talked about a lot of this in our latest Facts vs Feelings episode. Take a listen below.
For more of Sonu’s thoughts click here.
02099815-0224-A


