
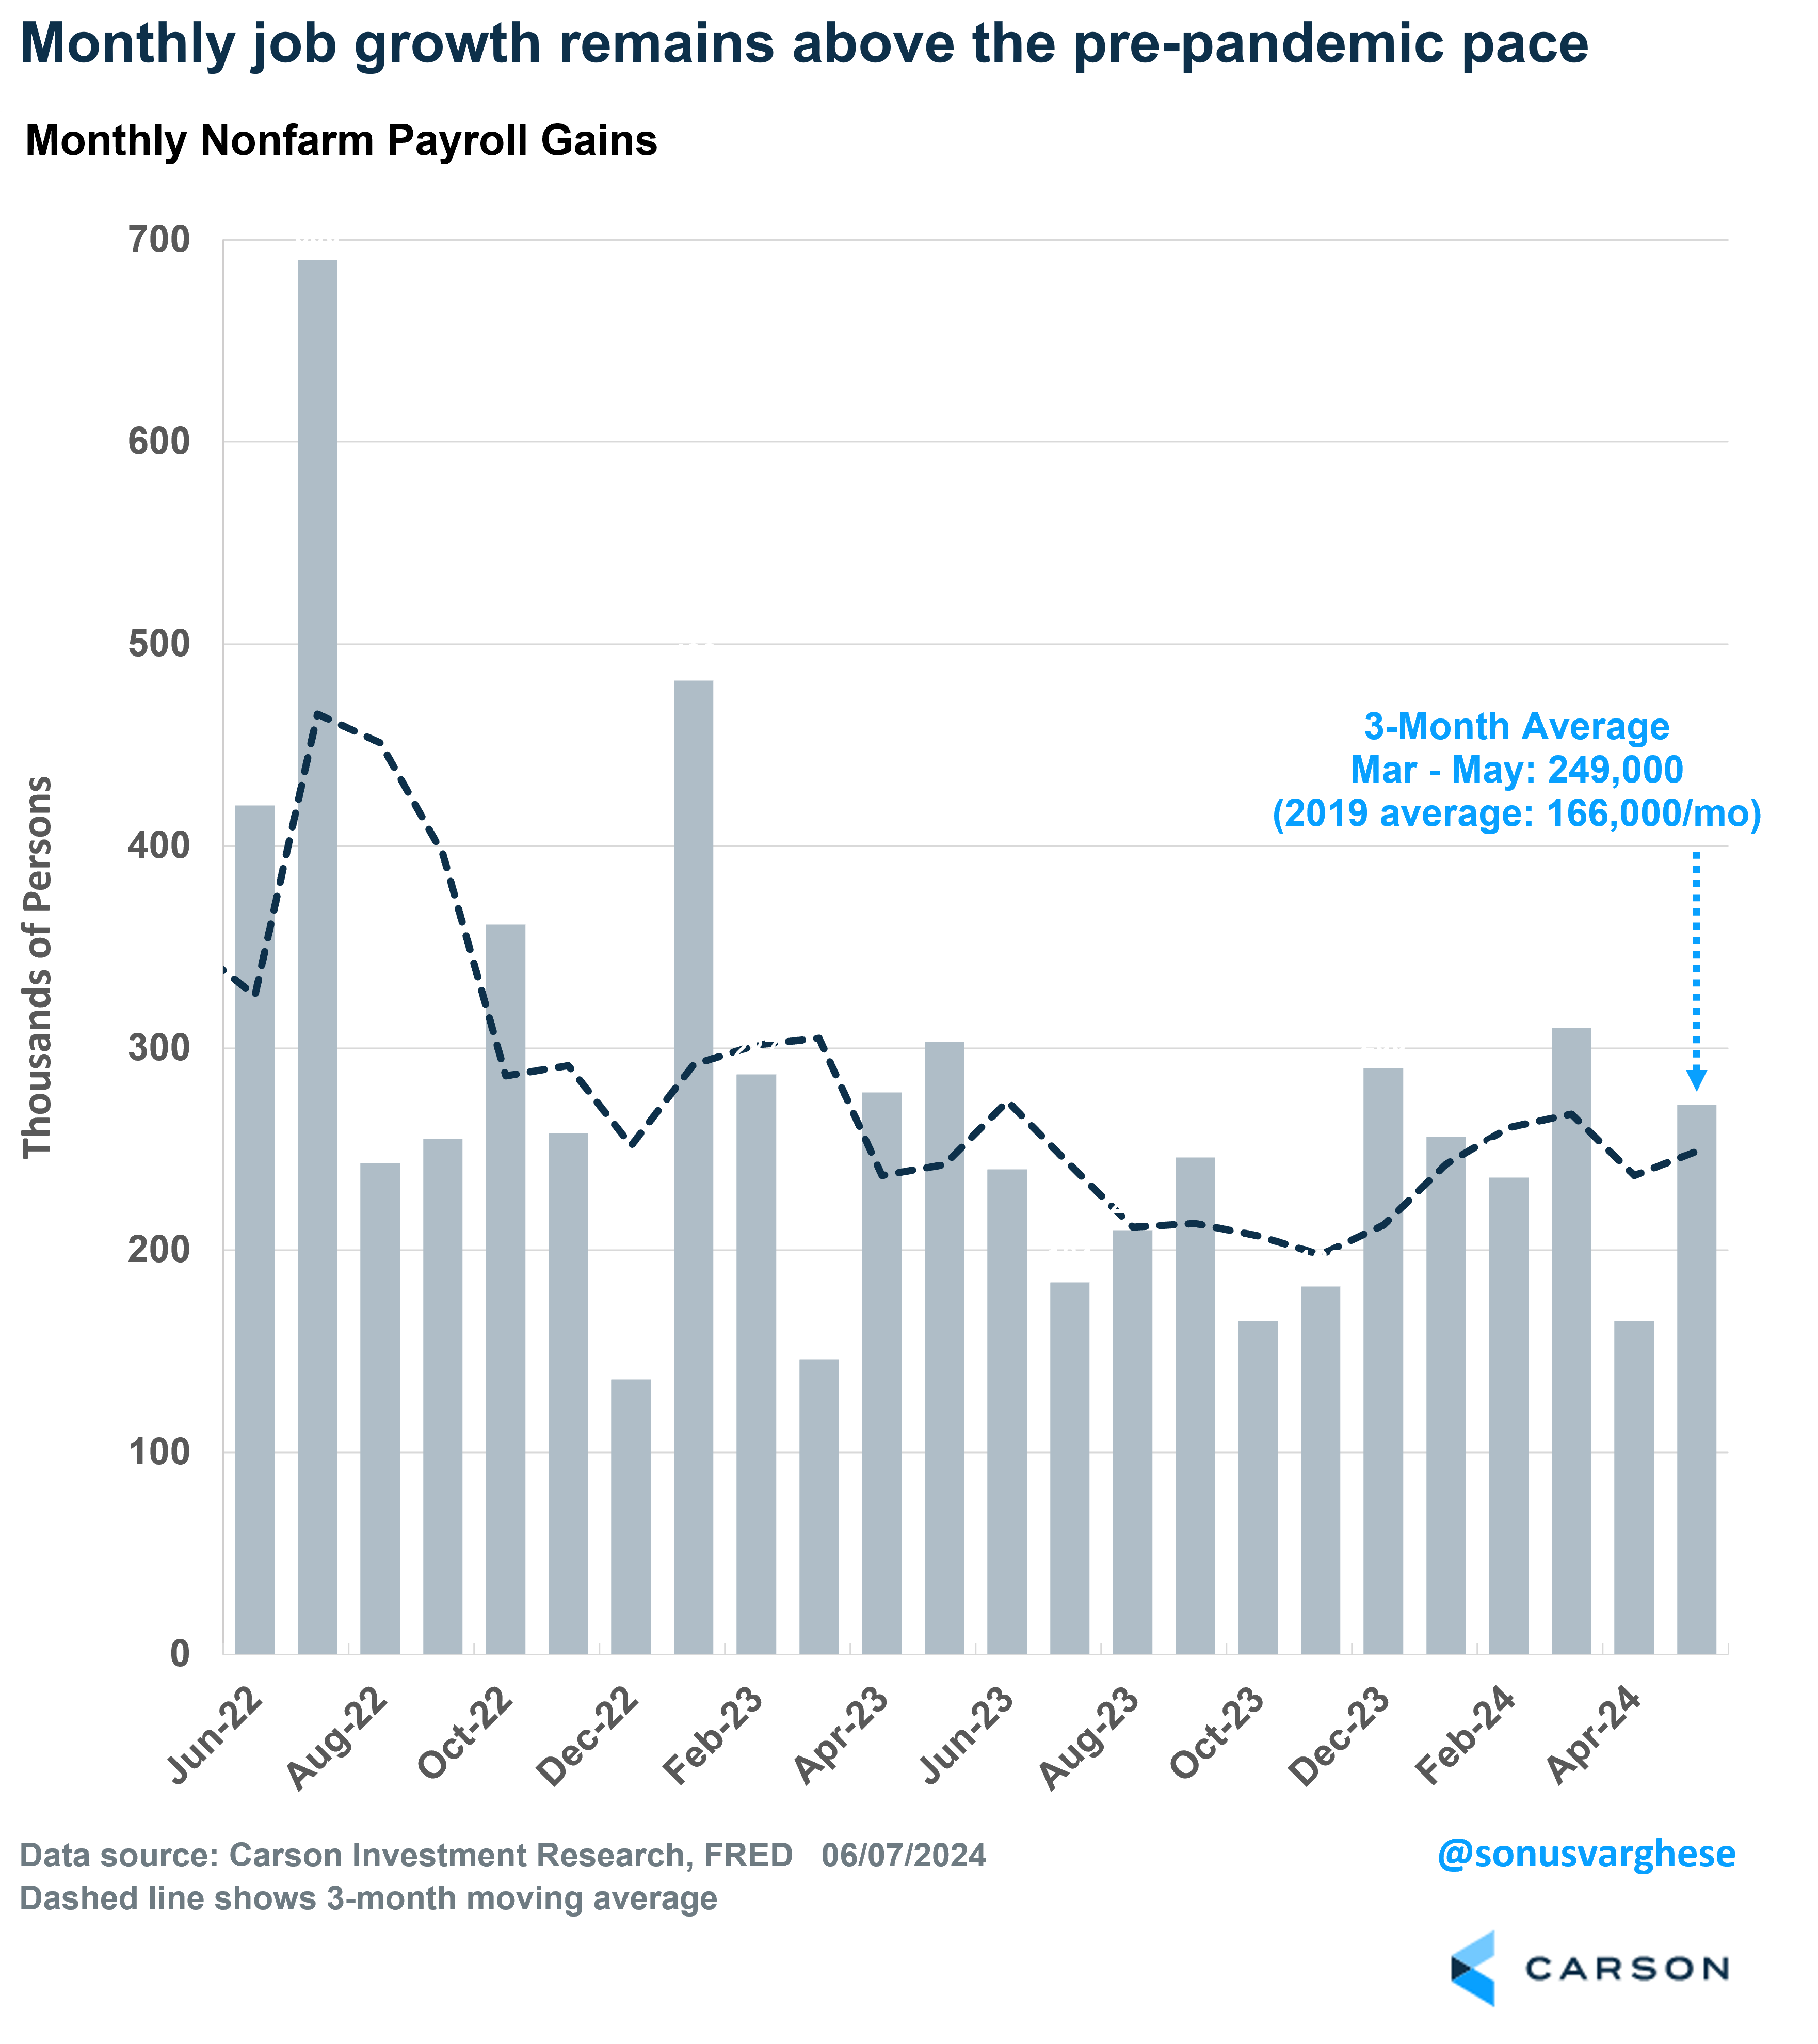
Job growth continues to catch most people by surprise, rising 272,000 in May. That was well above expectations for a 180,000 gain. In fact, “whisper” expectations (as much as one can glean from online chatter amongst economists and strategies) seemed to be tilted to a downside surprise, perhaps close to 150,000. Mostly because we’ve had some relatively weak data recently – including retail sales, disposable income, and services consumption – all suggesting that the consumer may be weakening (this was all April data). Well, the May payroll report upended that narrative. We didn’t even see significant revisions to March and April payroll numbers, and now the 3-month average sits at 249,000. A year ago, it was 242,000. In 2019, average monthly job growth was 166,000. There’s some perspective for you.
Now, the unemployment rate did rise to 4%, breaking a streak of 27 straight months in which it was below 4%. Not that 4% is some magic threshold. The unemployment rate data actually comes from what’s called the “Household Survey”, which is a survey of about 60,000 households. Whereas the payroll number comes from the “establishment survey”, which is a survey of about 119,000 businesses and government agencies (about 629,000 worksites). So, the household survey is noisier, with the confidence interval around employment about 600,000, versus 130,000 for the establishment survey.
Stay on Top of Market Trends
The Carson Investment Research newsletter offers up-to-date market news, analysis and insights. Subscribe today!
"*" indicates required fields
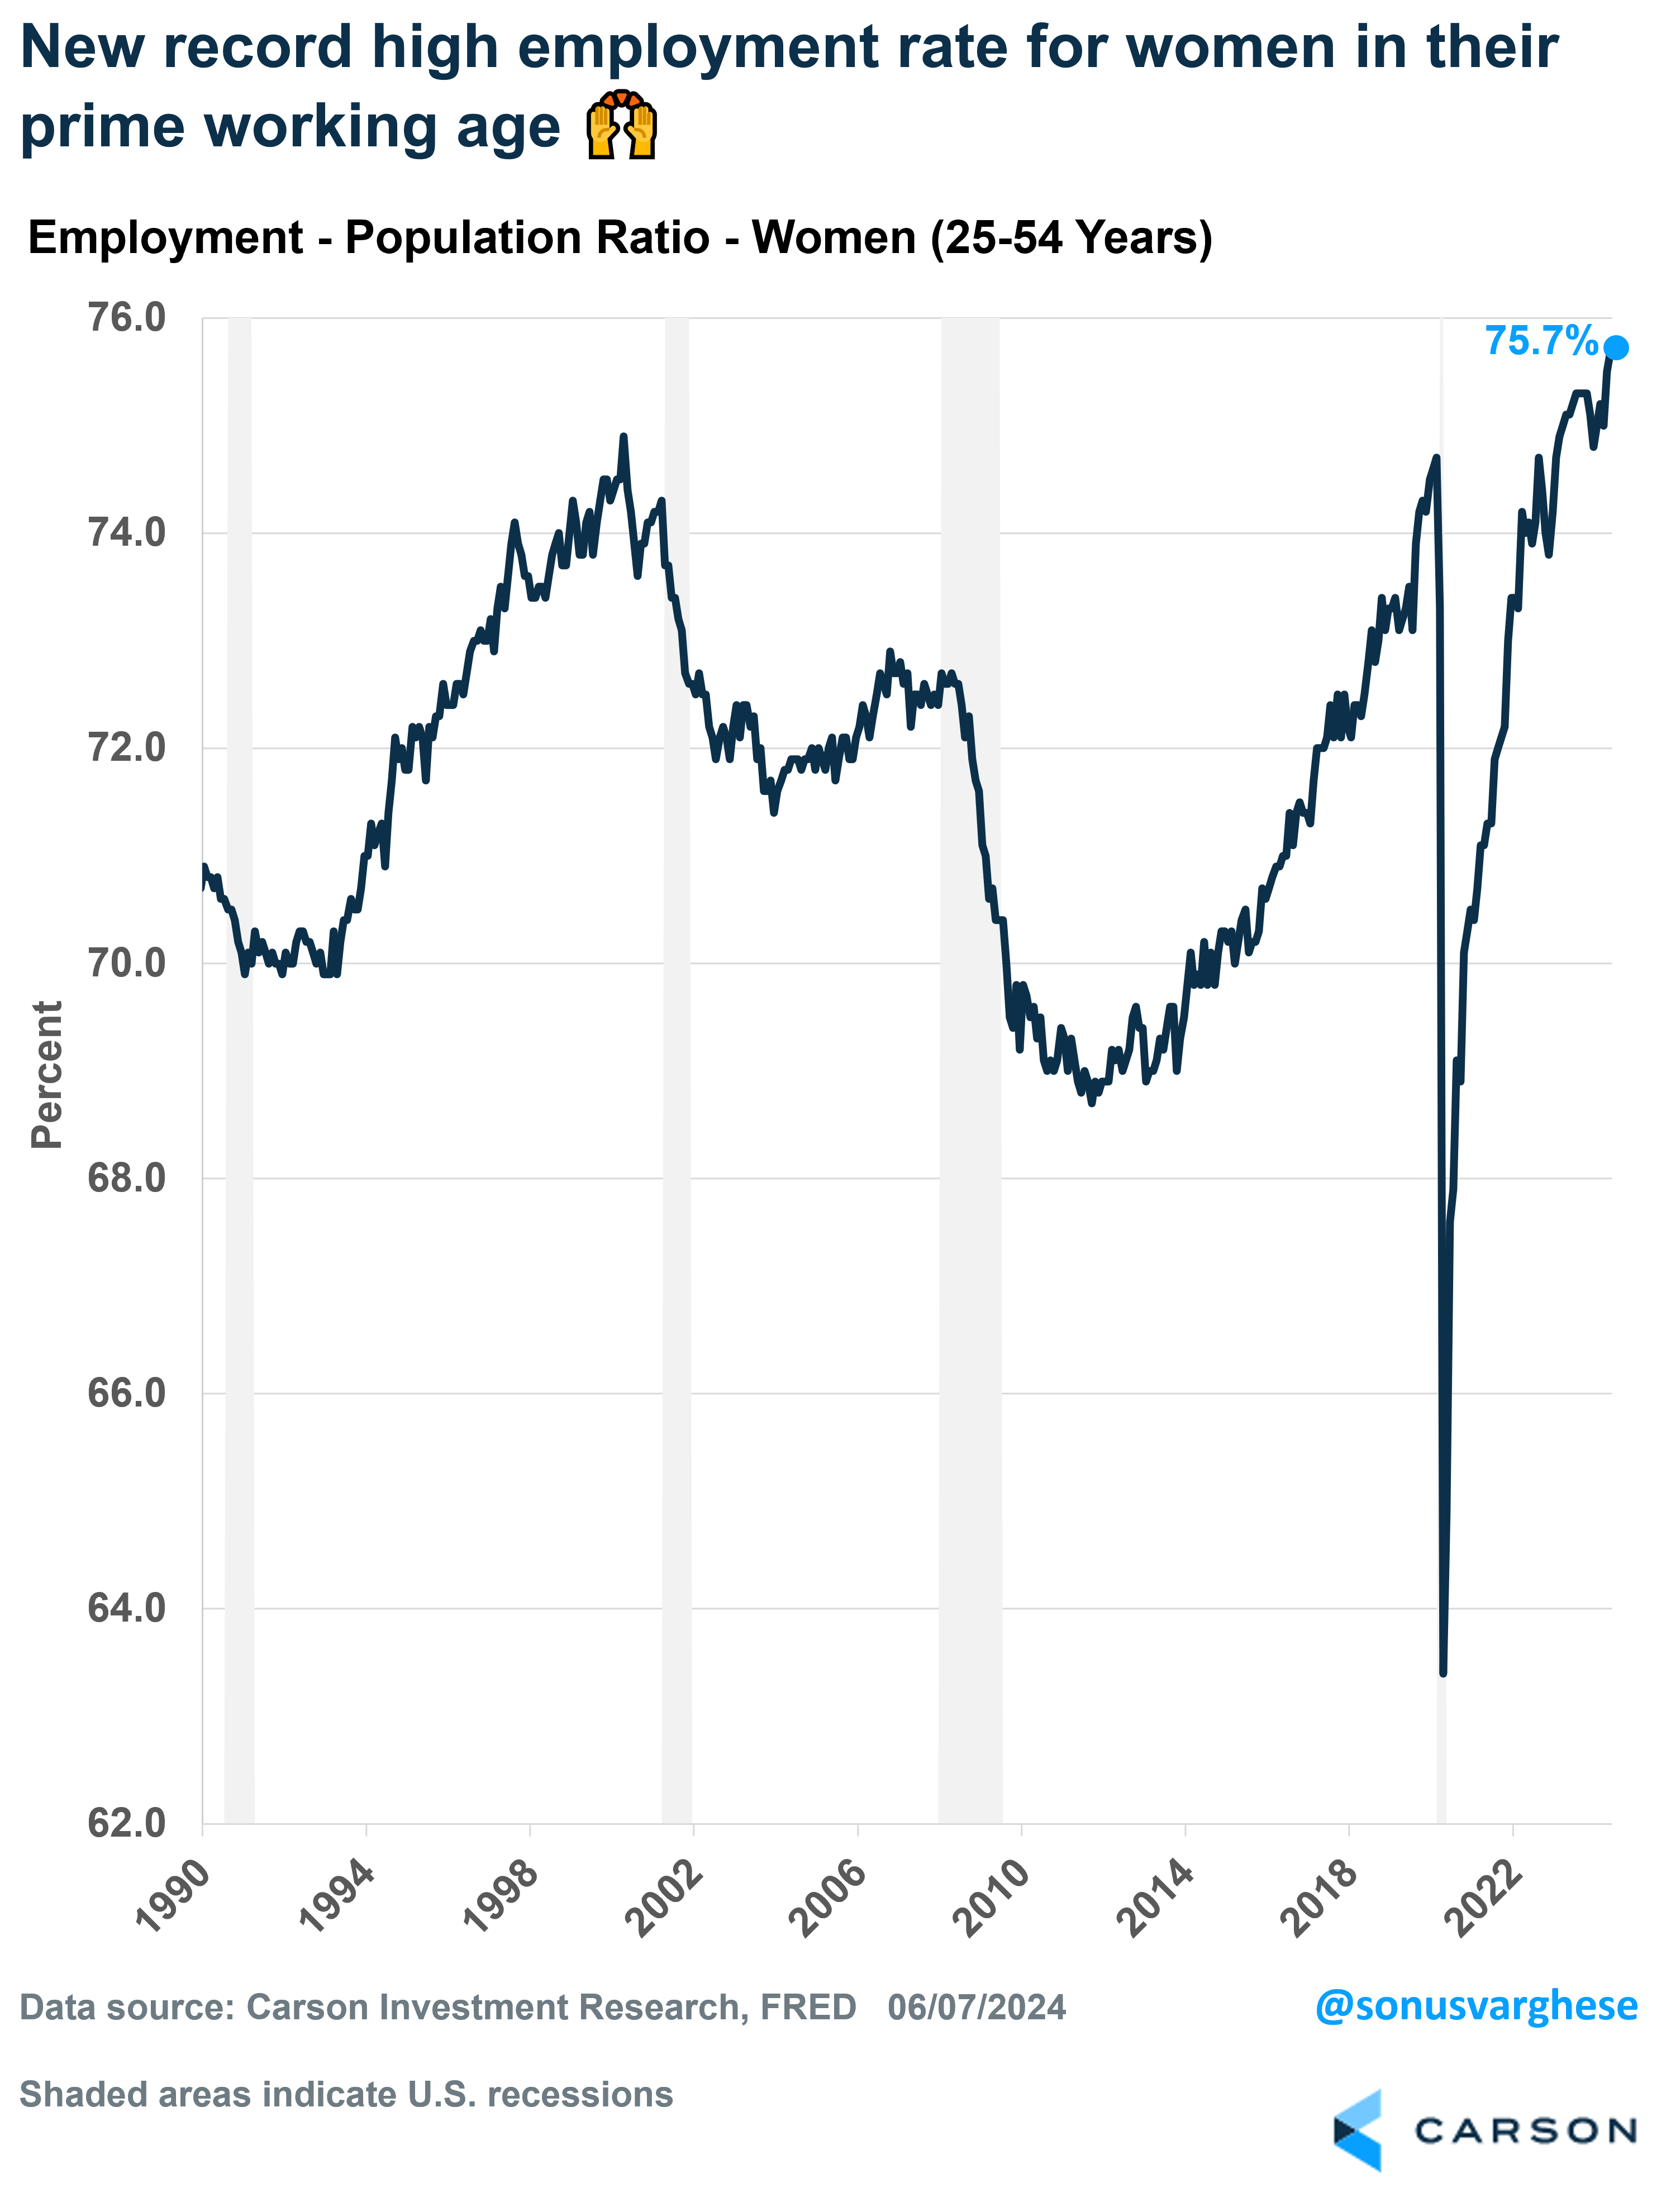
Over the last year, the unemployment rate has risen from 3.7% to 4%. That’s not too alarming. I’ve mentioned in previous blogs how I prefer looking at the “prime-age” (25-54 years) employment-population ratio since it gets around definitional issues that crop up with the unemployment rate (someone is counted as being “unemployed” only if they’re “actively looking for a job”) or demographics (an aging population with more people retiring and leaving the labor force every day). The prime-age employment-population ratio was unchanged at 80.8% in May. That’s only slightly below the high from last summer, and above anything we saw between 2001 and 2019 (when it peaked at 80.4%). In fact, the prime-age employment-population ratio for women hit a record high of 75.5% in April and rose to a new record of 75.7% in May. This should tell you the labor market is strong, with more people participating in it.
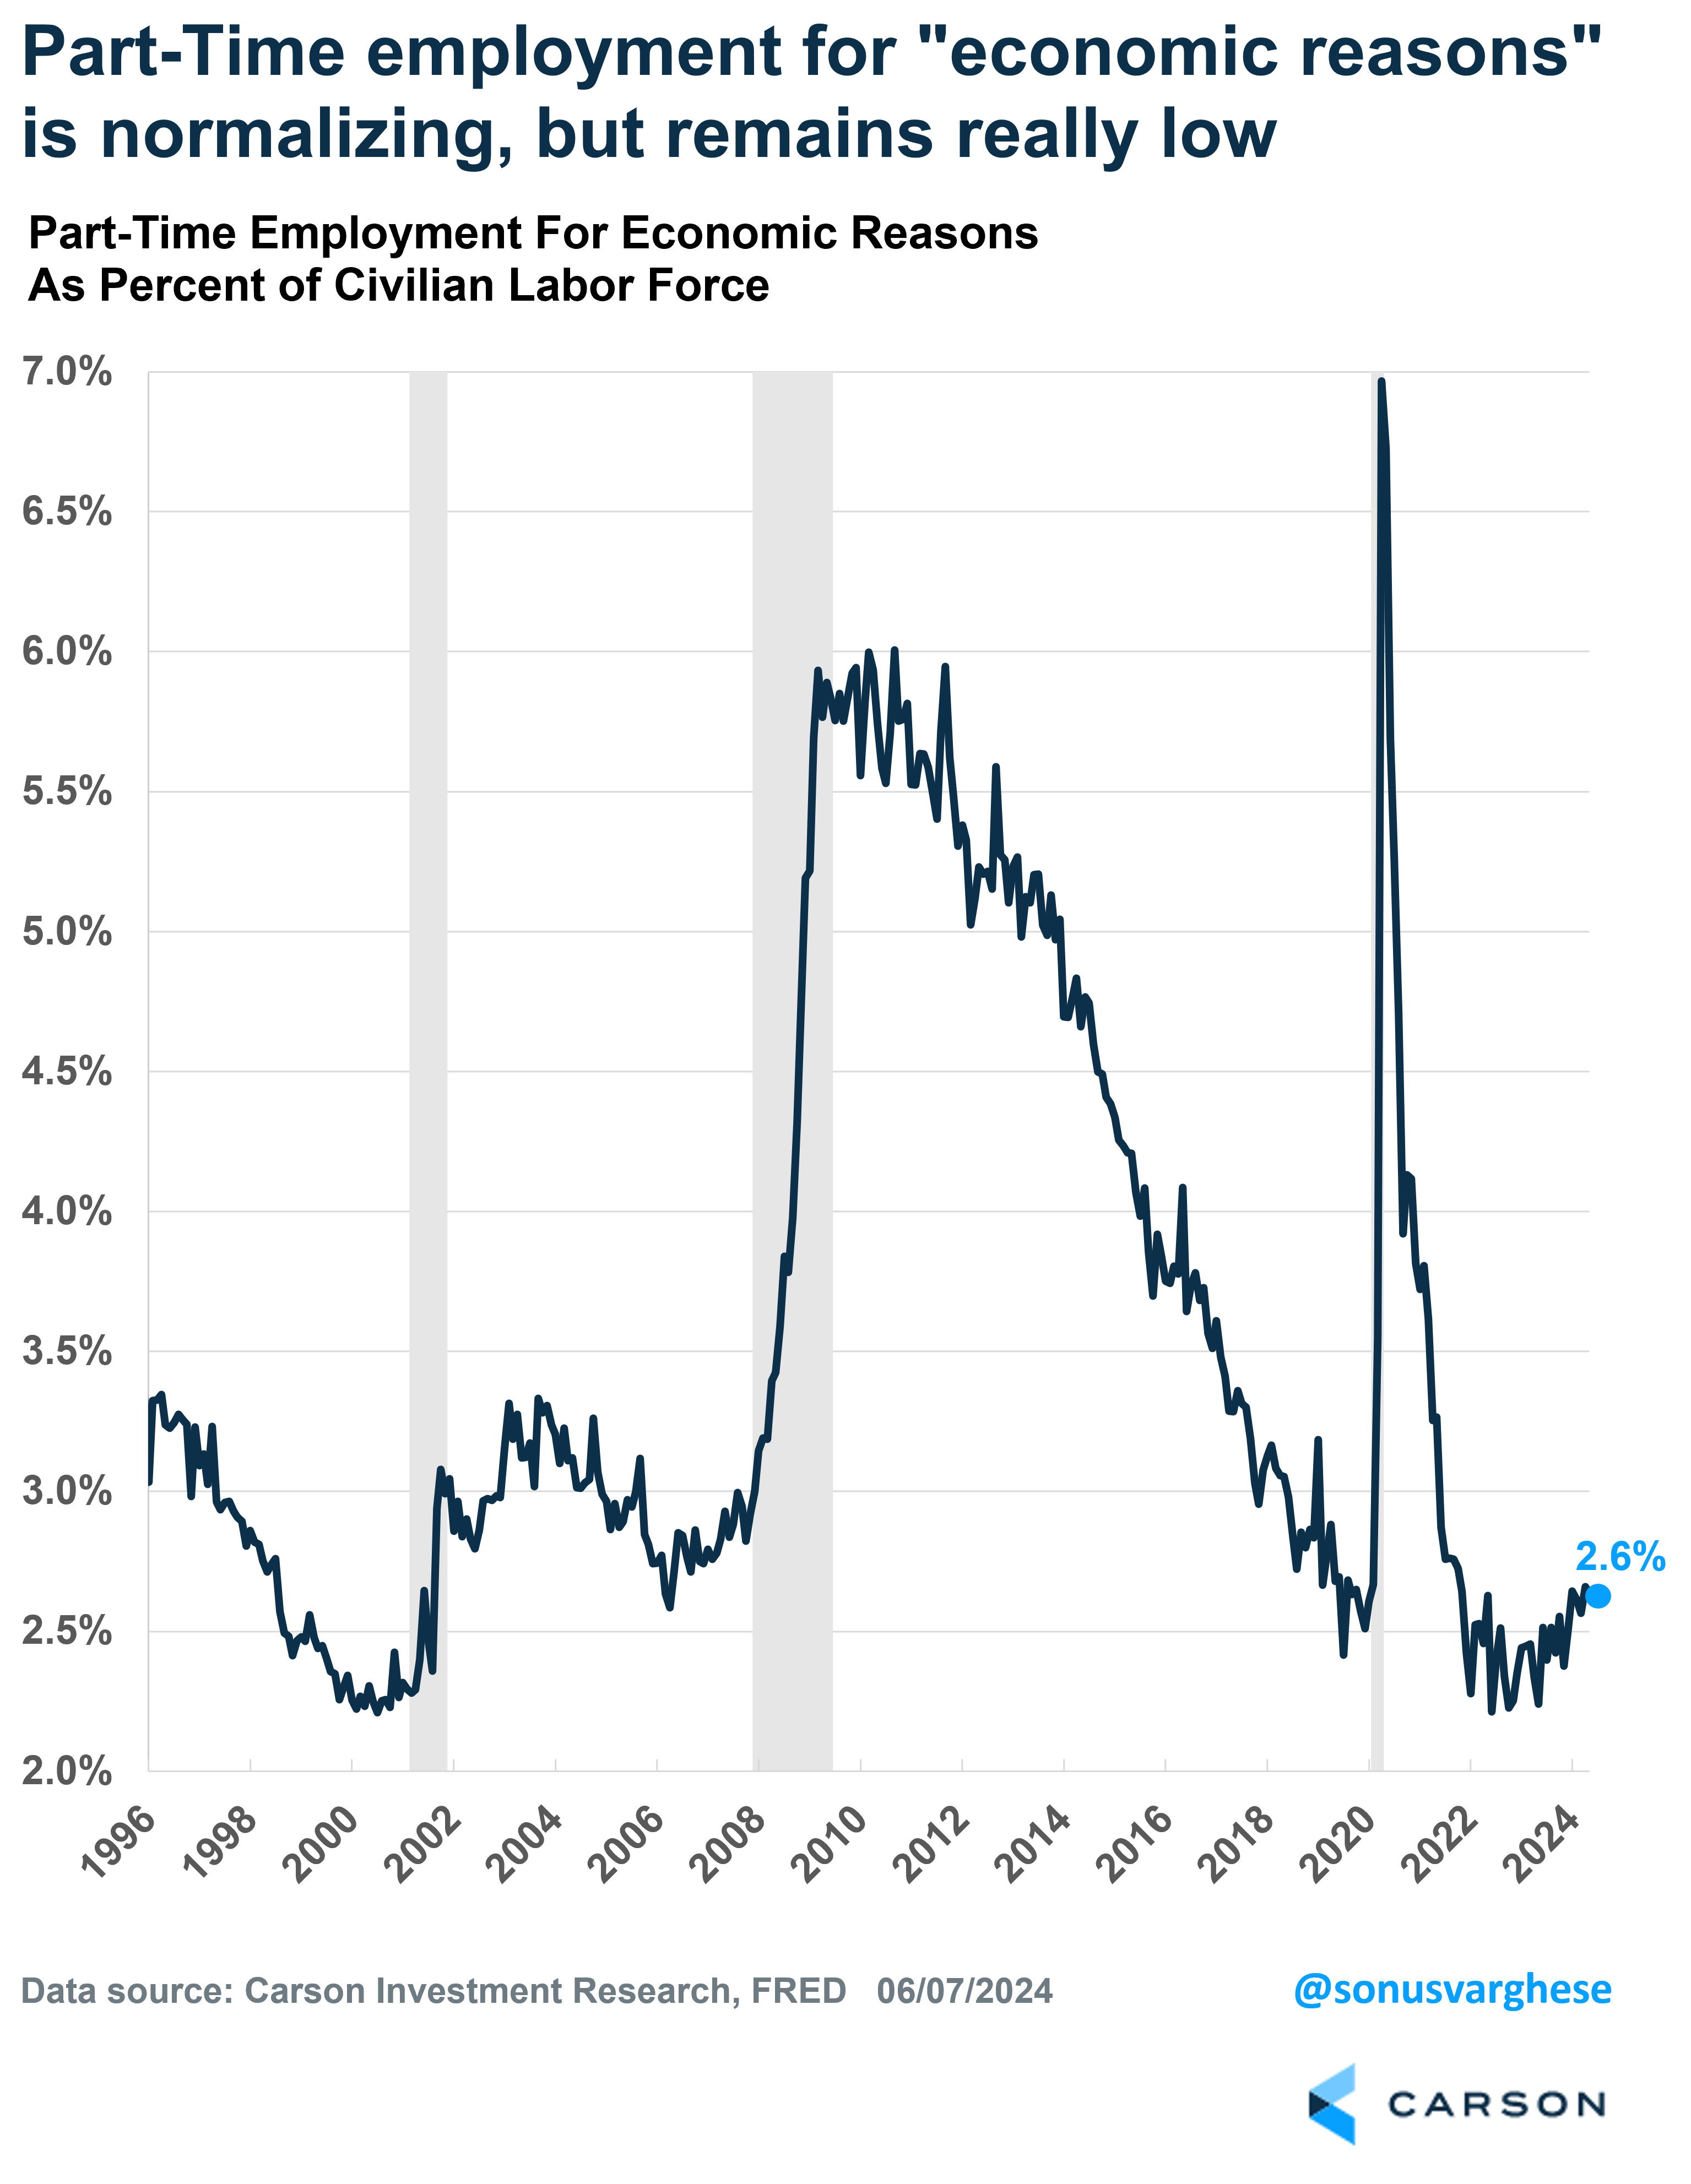
A narrative we’ve seen is that more people are working part-time. For one thing, we need to separate the reasons for why people are working part-time. Some people may be working part-time because they (or their partners) are earning enough, and so they can scale back. What would be worrisome is if more people started working part-time because they couldn’t find full-time work. The Bureau of Labor Statistics (BLS) actually measures this, via a metric called “part-time employment for economic reasons”. As a percent of the labor force, this measure is now at 2.6% – matching its level in February 2020 and a tick below the 2019 average of 2.7%. It’s increased over the past year, but that’s likely just the normalization of a labor market that is no longer red-hot. As you can see in the chart below, it remains at historically low levels.
What Matters for the Economy: Consumption (and Incomes)
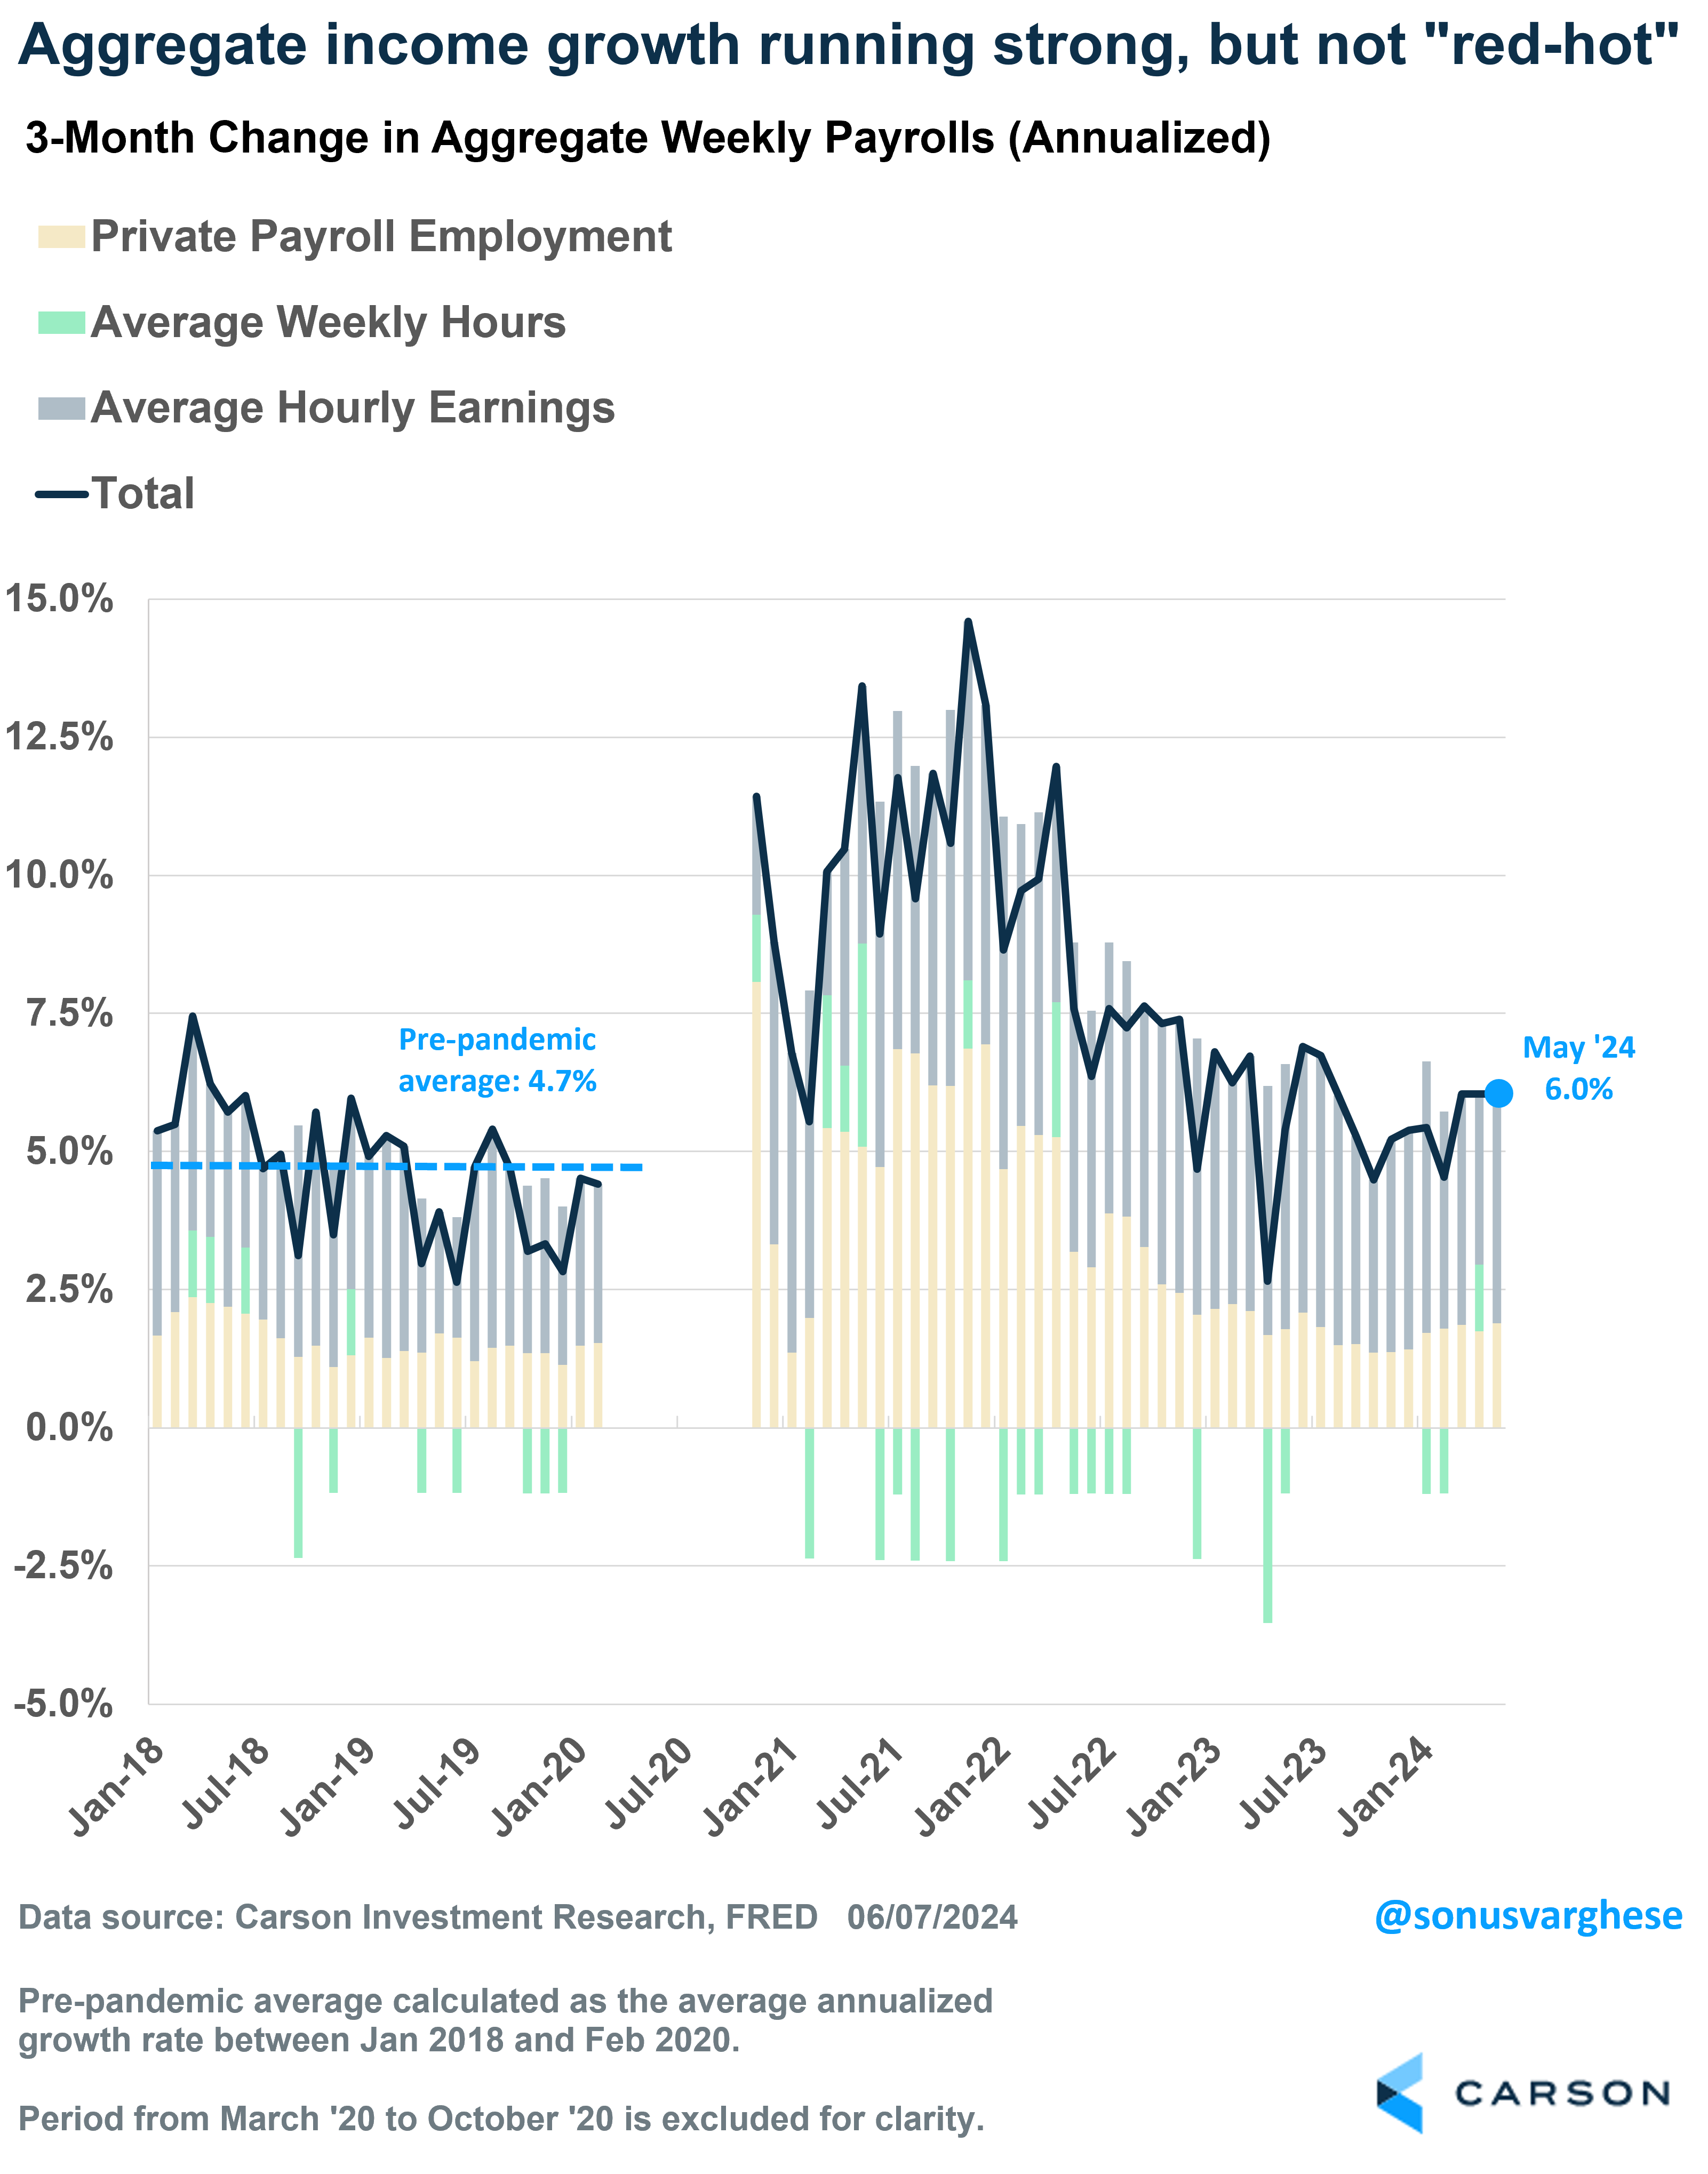
Consumption runs on income, and the picture there is positive. If you look at overall income growth across all workers in the economy (a product of employment growth, hourly wage growth, and hours worked), that’s running at a 6.0% annualized pace over the last three months. It’s been steady at that level for a few months now.
This pace is stronger than what we saw pre-pandemic, when aggregate income growth averaged about 4.7% annualized, but well off the red-hot levels of 10%+ in 2021-2022 (when inflation surged). So, this shouldn’t be something that concerns the Fed, i.e. a red-hot labor market that will drive inflation higher. At the same time, 6% aggregate income growth should be your best guess for nominal GDP growth, and that’s above the 2010-2019 trend of about 4%. Note that nominal GDP growth is directly related to corporate profit growth.
All in all, the big picture is that the consumer isn’t really weakening. That also means the economy isn’t weakening either, since consumption makes up close to 70% of the economy. While that means rate cuts by the Fed may take longer to materialize (perhaps only in September now), it also means profit growth remains strong, and that’s ultimately good for the stock market.
For more content by Sonu Varghese, VP, Global Macro Strategist click here.
02270646-0624-A