We recently got a couple of softer than expected economic report cards – Q1 GDP growth and the April payroll report – and suddenly we’re hearing more about an impending recession. In fact, the combination of these reports with hotter than expected inflation in Q1, has raised chatter about the dreaded “stagflation” scenario, i.e. low growth with high inflation.
Let’s be clear: we’re nowhere close to a recession, let alone stagflation. Stagflation is typically accompanied by high unemployment rates, whereas right now the unemployment rate has been below 4% for 27 straight months, the longest streak since the 1960s. Also, a stagflationary environment is one where inflation is running in the high single-digits, if not higher. Yes, Q1 inflation was hotter than expected, but over the past year through March, headline inflation is up 2.7% (using the Fed’s preferred personal consumption expenditures metric). A year ago, it was 4.4%. That’s the big picture on inflation.
With respect to a recession, the evidence is clear – we’re not in a recession, nor are we close to one. As I discussed in prior blogs, the “soft” GDP number hid underlying strength and the payroll report was actually quite good.

Stay on Top of Market Trends
The Carson Investment Research newsletter offers up-to-date market news, analysis and insights. Subscribe today!
"*" indicates required fields
Admittedly, it can be hard to get a full picture of the economy as the data comes rolling in week after week. This is why we have our own Carson Leading Economic Indicator (LEI), for the US and 28 other countries. For the US, the LEI includes more than 20 components that capture the dynamics of the US economy. These include:
- Consumer-related indicators
- Housing indicators
- Business and manufacturing activity
- Sentiment
- Financial markets
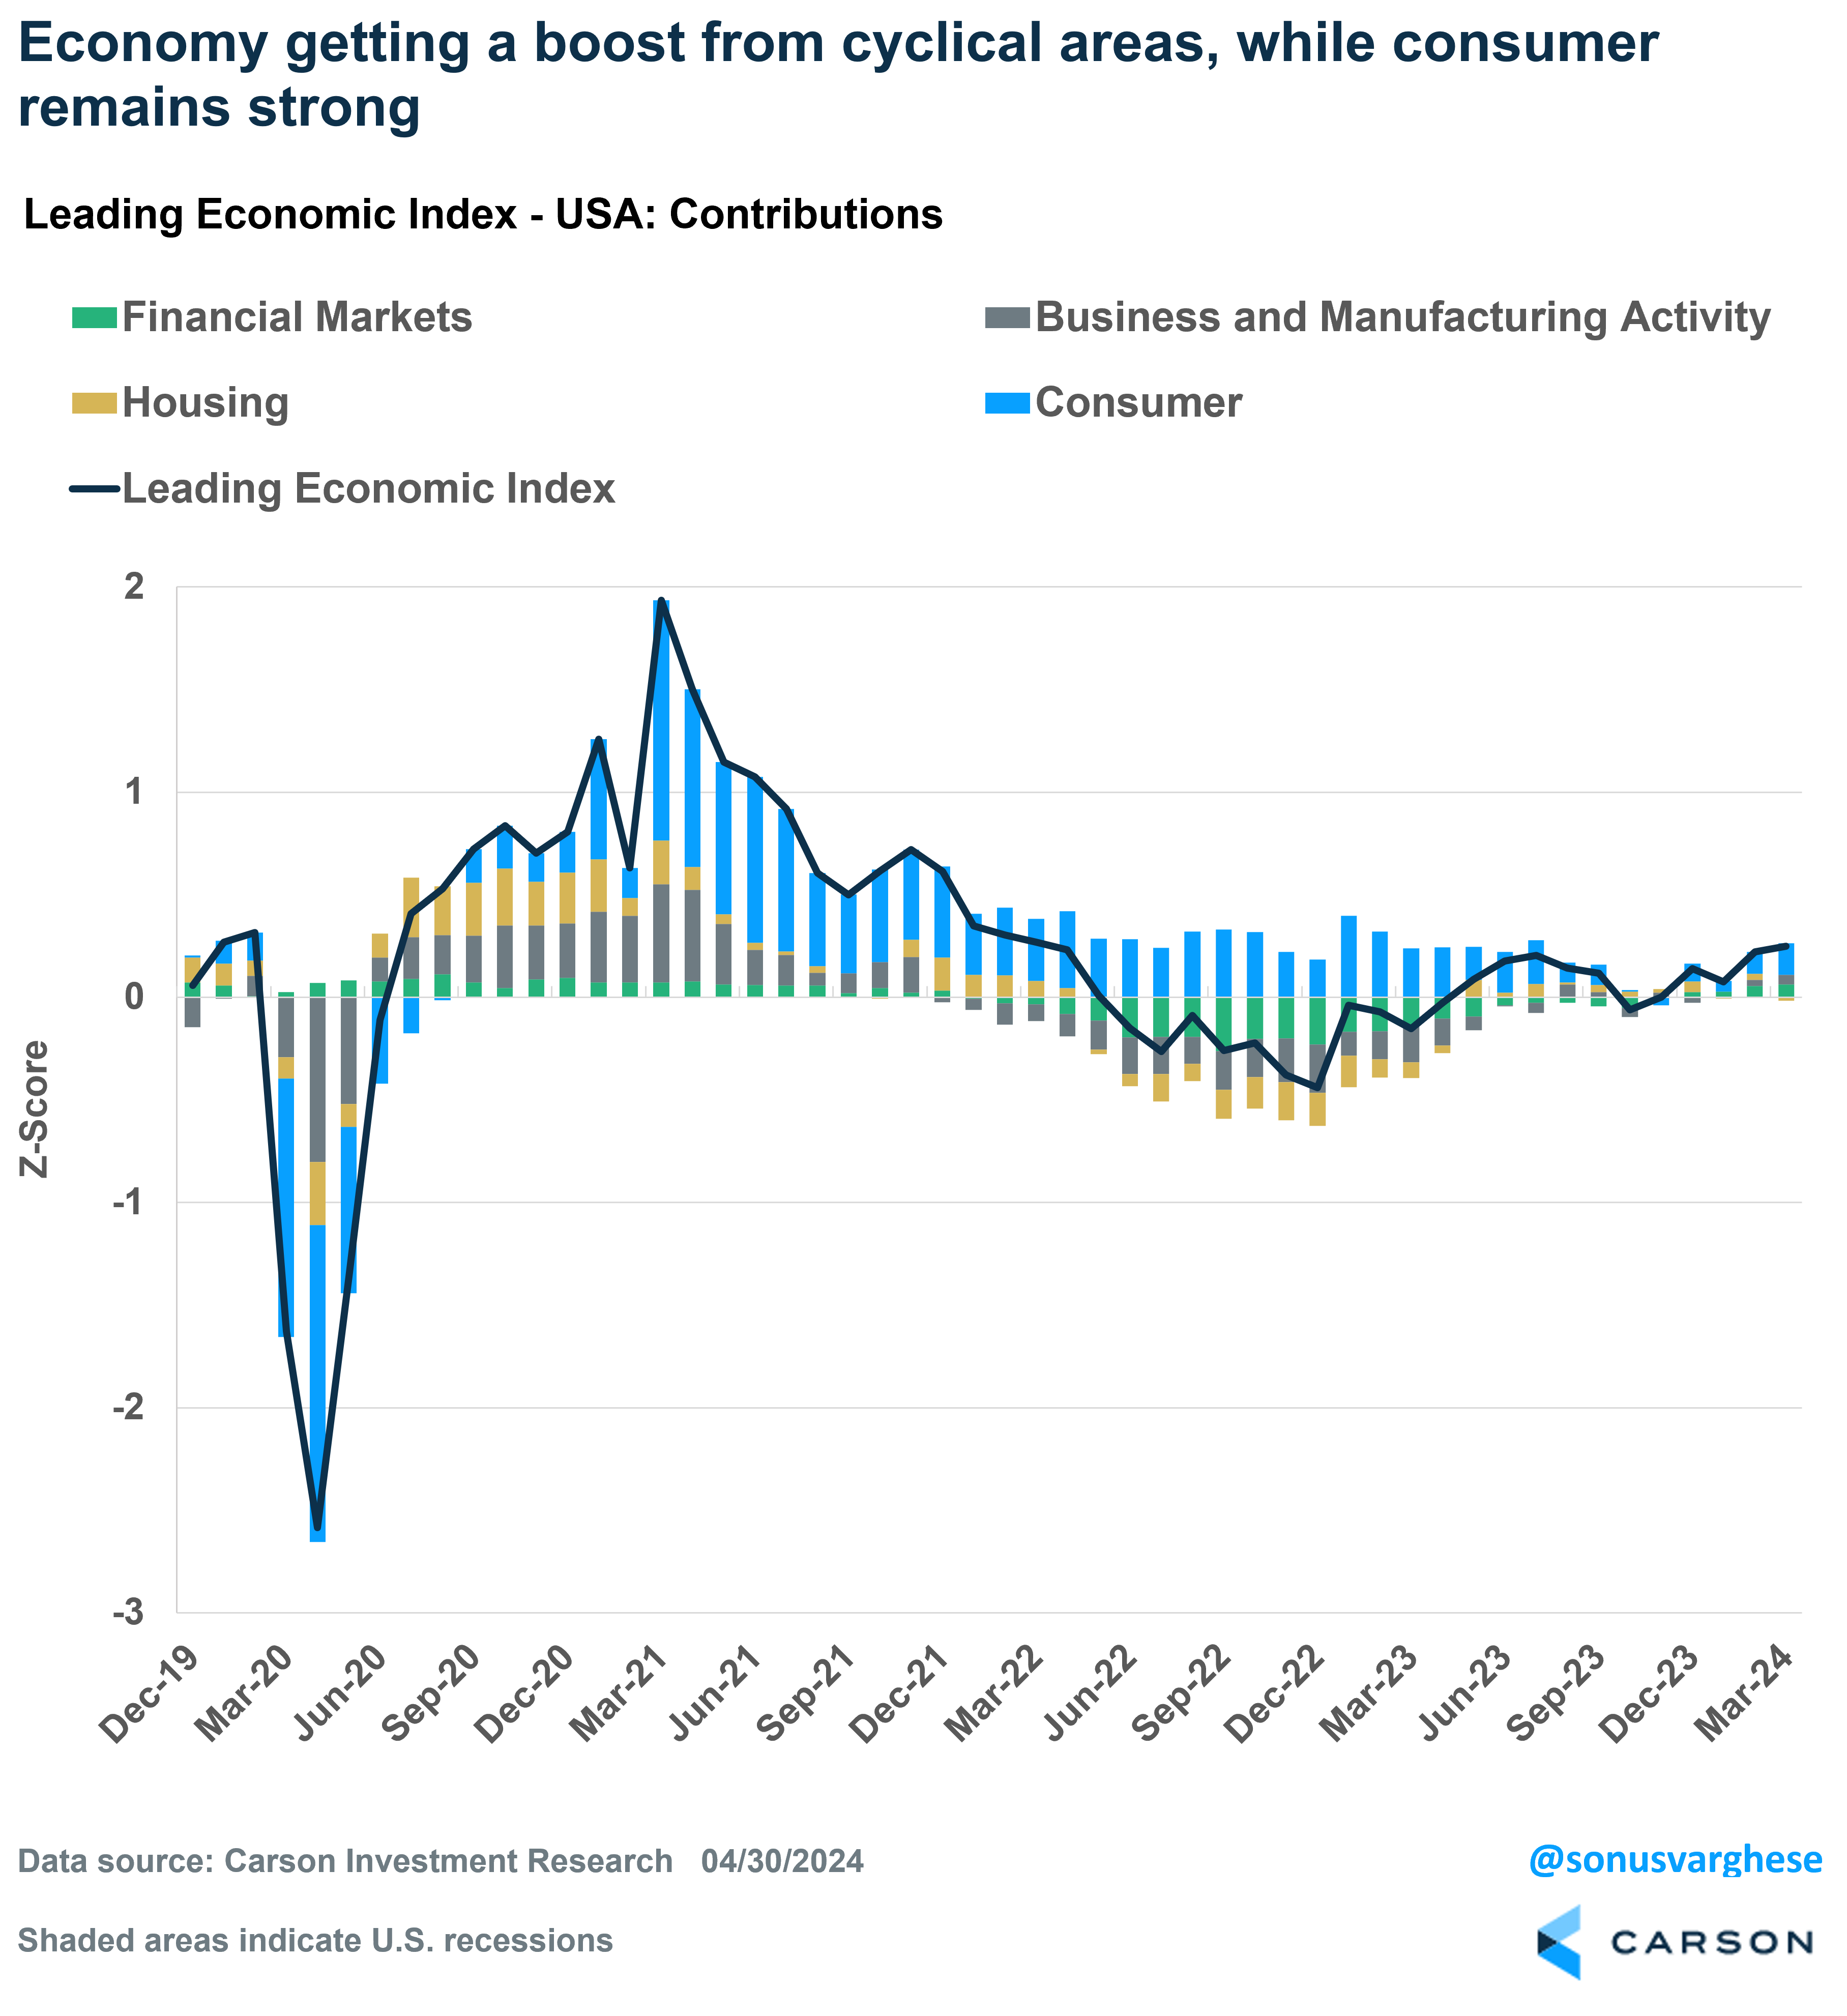
The Carson LEI tells us whether the economy is currently growing below trend (or recession), above trend, or on trend (with a value close to zero). Think of it as a “nowcast” of the economy as opposed to a forecast. In other words, we’re trying to figure out what the economy is doing now, which can be hard enough (as you can tell, opinions vary on this). Instead of figuring out what the economy will be doing 6-12 months from now, which can be even more difficult. And since economic conditions typically don’t change on a dime (except in March 2020 due to Covid-19), we’re comfortable projecting that view over the near term (1-3 months), all the while continuously updating our index with new data. As you can see in the chart below, our LEI can potentially warn us of recessions ahead of or at their early onset. Importantly, it did not point to a recession in 2022 or 2023, which is why we maintained that the US would avoid a recession throughout the last year and half.
The good news is that the US LEI currently points well away from a recession. The index has been rising in recent months, indicating growth is running above trend.
The recent upswing has come on the back of a strong consumer, coupled with rising investment spending. Housing is no longer a drag as well, as it was in 2022 and most of 2023. The economic picture is certainly better than a year ago. To jog your memory, a year ago there were concerns about a potential banking crisis after the collapse of Silicon Valley Bank. The banking system has held up, and economic growth has run ahead of the pre-pandemic 2010-2019 trend. Again, we were able to capture this in real-time using our LEI.
In a nutshell here’s what’s happened since 2022, when the Fed aggressively started raising interest rates, and captured in our LEI:
- Contrary to most forecasts, the economy avoided a recession in 2022-2023 thanks to strong household spending, which more than offset the drag from tighter interest rates (which pulled housing and business investment lower)
- Then in the second half of 2023, and into 2024, the cyclical areas of the economy – business investment and housing – started to recover and add to GDP growth. Even as consumption remained above trend on the back of a strong labor market.
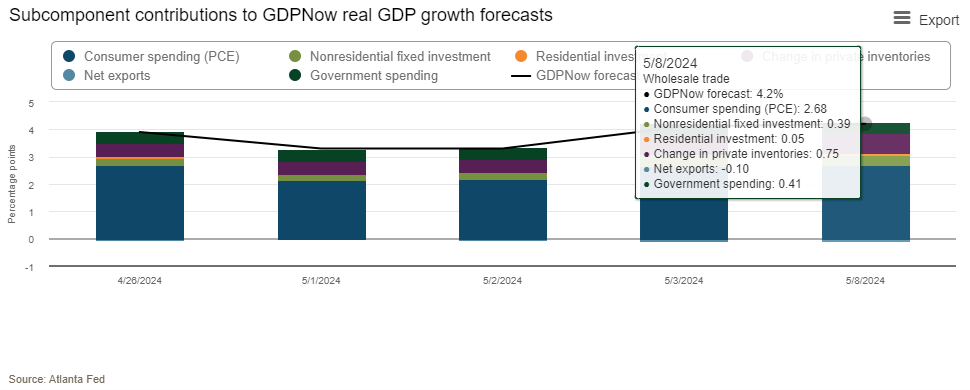
In fact, the Atlanta Fed’s GDPNowcast for Q2 GDP growth is currently at a whopping 4.2%. It’s early days yet and we still have a couple of months worth of data to get for Q2, but so far, the data points to strong growth. In fact, if you take out the volatile parts of GDP – inventories and net exports – as well as government spending, the nowcast puts “real final private demand” (spending by households and businesses) at 3.1%. For perspective, that was the same pace as in Q1 and higher than the 2.4% trend between 2010-2019.
The strength of the economy is currently being recognized by economists as well, with 2024 GDP forecasts starting to rise. As our friend, Neil Dutta, the Head of Economics at Renaissance Macro, recently pointed out, the Bloomberg News consensus for 2024 GDP growth expectations have jumped from under 1.5% at the beginning of the year to about 2.4% now.
Ryan Detrick, Carson’s Chief Market Strategist and I regularly talk about what’s happening about the economy, and how that impacts markets, on our Facts vs Feelings podcast. Take a listen to the latest episode, in which we chatted with Eddy Elfenbein, portfolio manager and author of the widely read blog “Crossing Wall Street”. Eddy picks individual stocks for a living and he’s got great perspective on the economy from that side of things. Take a listen:


