“Why did God create economists? To make weather forecasters look good.” -Old economist joke
Two things to think about today.
1.) Since the Great Financial Crisis (GFC) ended 15 years ago our economy has been in a recession only 1.1% of the time.
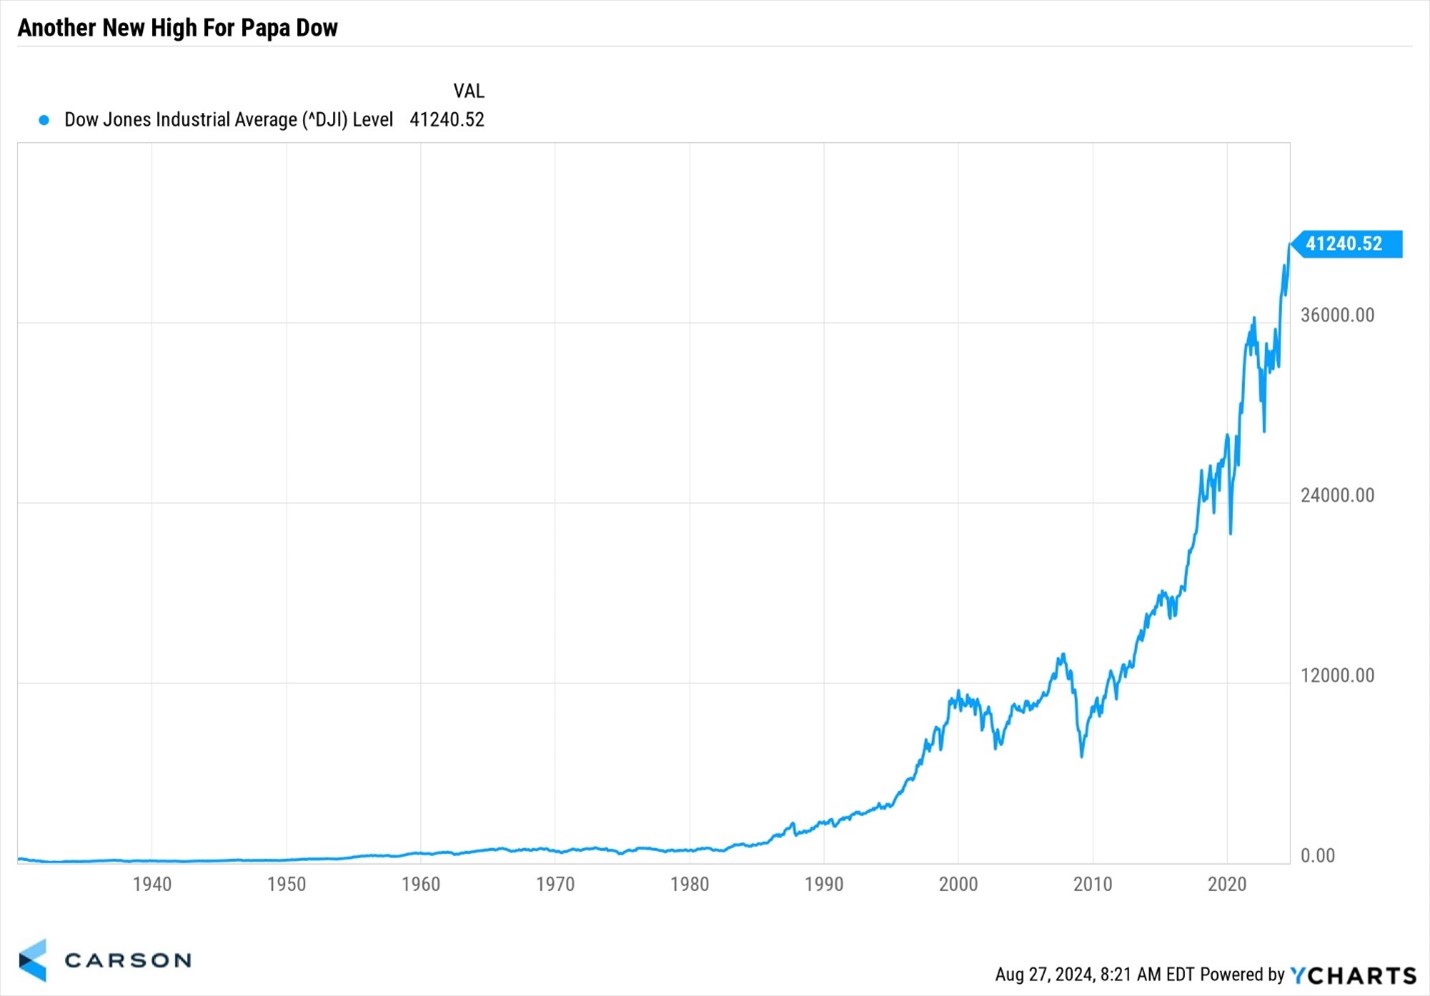
2.) The Dow Jones Industrial Average started trading on May 26, 1896, and on Monday AND Tuesday this week it closed at the highest level EVER.
Think about how many endless discussions have focused on the ‘coming soon recession’ only for stocks to continue to soar.
Just the past year we’ve been hit with worries over the yield curve, leading indicator indexes (LEI), small sample-sized purchasing manager surveys, wars, inflation, and the Bank of Japan (BoJ) hiking rates by just over 25 basis points (as silly as that last one sounds, it happened three weeks ago). None of these things have slowed down the bull market.
Since 1900 the US economy has been in a recession 22.4% of the time. But did you know six months after a new all-time high in the Dow it has been in a recession only 8.9% of the time? And the last time it hit a new high during a recession was in late 1982, which also kicked off a huge bull market.

Stay on Top of Market Trends
The Carson Investment Research newsletter offers up-to-date market news, analysis and insights. Subscribe today!
"*" indicates required fields
One of the better indicators regarding the economy historically has been the stock market. Yes, stocks hit new highs right before COVID and in early 2007, but the great majority of the other times over the past generation new highs have meant an economy that was growing, not an economy in a recession. New highs are another clue that our economy will likely avoid a recession over the next six months (but probably longer).
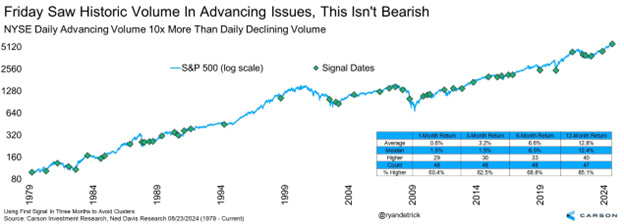
Let’s now get to the data. Stocks rallied across the board on Friday as Powell made it crystal clear inflation was last year’s problem and rate cuts were coming. As a result, we saw a huge rally, with nearly everything higher. In fact, up volume at the NYSE was nearly 11 times larger than the down volume. The last time we saw more in one day? The exact lows in mid-October 2022 and the end to that vicious 25% bear market. I found that after previous 10x days the S&P 500 was higher a year later 85% of the time and up nearly 13% on average. (Note the average year is higher about 71% of the time and up around 9% on average.)
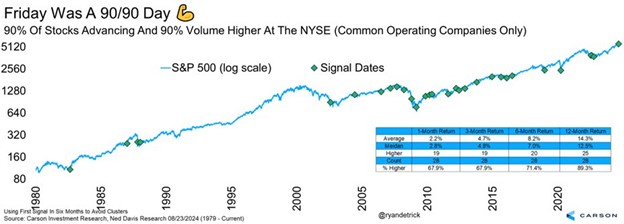
But it wasn’t just about volume, as more than 90% of all the stocks on the NYSE were also higher. For this I used data from our friends at Ned Davis Research that focuses on common operating companies only, which tosses out things like preferreds and focuses purely on companies. Doing this we looked at what we call a 90/90 day, meaning 90% of all the volume on the NYSE was higher and 90% of the stocks were higher. These rare days tend to occur near the end of weakness or during uptrends. 90/90 days were higher a year later 89% of the time and up an average of 14.3%, once again suggesting we are still in a healthy bull market.
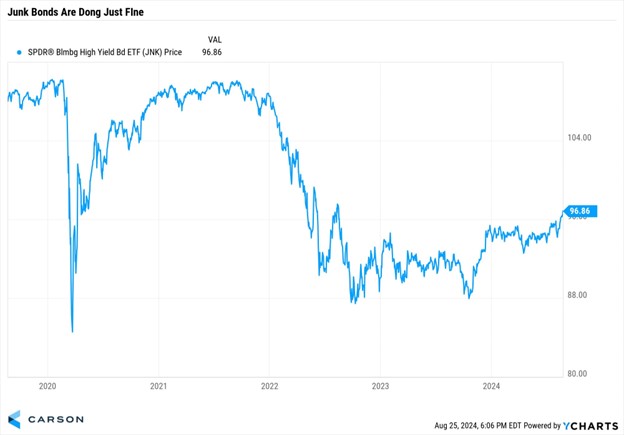
Lastly, the action in junk bonds (also called high-yield bonds) continues to suggest a risk-on appetite, as they are near their highest level in two years. If things were as bad as they keep telling us, you’d think some of the riskiest assets (companies that might not pay you back) would be weaker. Well, they aren’t. I learned a long time ago that if credit markets were confident, then I should be confident. This is another sign this bull market is alive and well.
Thanks for reading and be sure to watch below, as I joined Morgan Brennan on CNBC’s Closing Bell Overtime yesterday to discuss many of these concepts.
For more content by Ryan Detrick, Chief Market Strategist click here.
02386089-0824-A

