
We sometimes get questions about why we think stocks will continue to go up in the long run. That gives me an opportunity to refer back to some of our favorite long-term investing charts that capture our views.
Almost exactly a year ago, our Global Macro Strategist Sonu Varghese wrote a piece called, “This Is Likely the Best Investment Over the Next Five Years.” The “this” in the title is the S&P 500 and looking at 2024, Sonu’s analysis is off to a pretty good start. In case you might have missed out on some of those gains, Sonu wrote a kind of companion piece back in June called, “How Does One Positively Expose Oneself to Luck While Investing?”
The downside of stocks’ return potential is volatility, something we experienced in the second half of July and early August this year during the S&P 500’s largest drawdown of the year. Our Chief Market Strategist Ryan Detrick provided perspective on that in an August 6 blog called “10 Talking Points About the Recent Volatility.” In addition to including some favorite long-term investing charts, it also provided some timely advice, as the day it was published stocks began to rebound.
Stay on Top of Market Trends
The Carson Investment Research newsletter offers up-to-date market news, analysis and insights. Subscribe today!
"*" indicates required fields
Getting back to the question of why we think stocks will continue to rise in the long run, there are two perspectives to take. One is to look at stock market history, which provides a helpful picture of the risk premium stocks have historically earned. But there are also sound underlying reasons for those gains. Primarily, stock ownership is an equity interest in a company’s profits, some of which is distributed via dividends (and indirectly through share buybacks) and some of which is reinvested, potentially contributing to future earnings growth and dividends.
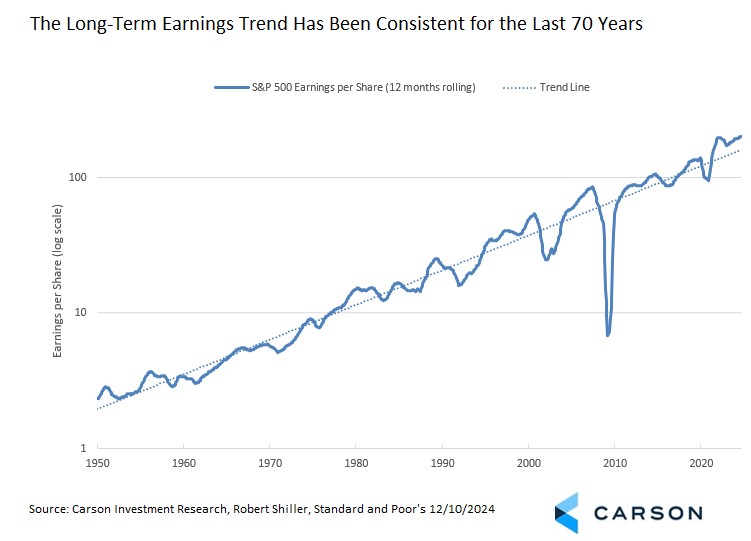
S&P 500 earnings gains have been fairly consistent over the last 70 years from a big picture perspective. (The chart is scaled so that the trend line represents a steady growth rate.) There is a lot of short-term wiggle in earnings per share that can have a large impact on short-term market returns, but over the long run there’s a clear trend. It’s there due to a combination of economic growth supporting sales growth, margin expansion, US companies competing effectively for global market share, and index construction (better growing companies being added to the index over time as they meet the criteria for inclusion, worse growing companies being removed as they fail to meet the criteria). At it’s simplest, if you believe in long-term GDP growth (that is, the economy won’t be in a perpetual recession or near recession) you should believe in earnings growth, and if you believe in earnings growth, you should believe in the prospect for long-term stock gains.
But earnings growth is not the only driver of returns. Stock returns can easily be broken down into three pieces: dividends, earnings growth, and valuations. The chart below has our estimate for the 10-year rolling contribution of each to the S&P 500’s return staring in the labeled year (so the final data point is 2014 – 2023).
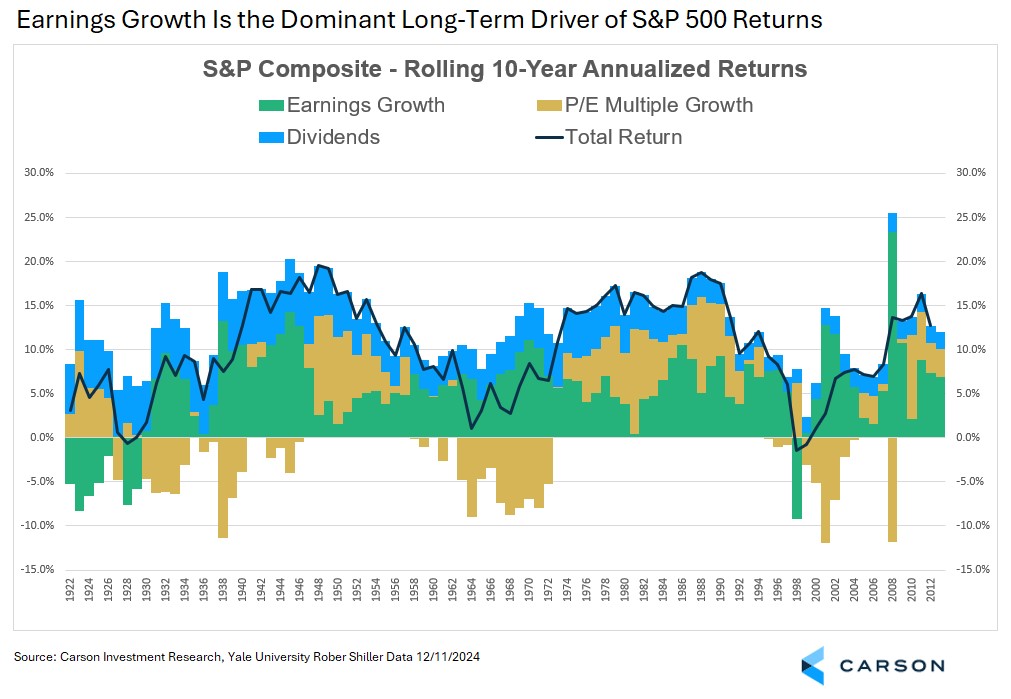
Some quick observations and then we can take a deeper dive. Earnings (green) tend to be the dominant driver of returns and are rarely negative over a 10-year period. The exceptions are the periods ending during the Great Depression and the one period ending the year of the Great Financial Crisis (2008), since earnings took a historically unusual tumble that year. Dividends (blue) are your slow and steady contributor, although their contribution has narrowed over time. Multiple growth is unusual because it can swing between being a contributor and a detractor for an extended period of time.
Dividends’ contribution is always positive, since it’s a distribution. The typical level of dividends has generally fallen steadily over time, running at about 2% per year over the last decade, but it’s still an important contributor to returns.
Multiple growth (also called valuations) depends on the amount investors are willing to pay for a dollar of prospective earnings, and it therefore reflects how investors are pricing the market at any given time. Price multiples have some natural unknown fair value that acts as a center of gravity over longer time periods. High multiples will tend to revert lower; low multiples will tend to revert higher. But it’s very difficult to know when that mean reversion will take place, with the general guideline that “some time in the next decade” is a reasonable assumption. That means it’s entirely normal for multiple mean reversion not to happen over the next five (or more) years, which is why we always emphasize that valuations aren’t a market timing mechanism.
That fair value multiple may also trend very slowly over time as business fundamentals, technology, index make-up, and economic fundamentals change, but the impact on prices from that is modest. That potential trend does add to the difficulty in knowing what the fair value level is, which is part of why using a long-term history for estimating today’s level should be taken with a grain of salt. In the near term, multiples changes are driven largely by runs of positive or negative sentiment that eventually get pulled back to fair value. Because that fair value level is a center of gravity, changes in multiple can have a profound short-term effect on stock returns but are generally neutral in the very long run.
Finally, there’s earnings, which typically grow more quickly than dividends in the long run, especially over the last 50 years as the index’s dividend yield has contracted. Earnings growth is easily the largest contributor to stock gains, but there was a time when stocks distributed more of their earnings and dividends were almost as important. Over the last 100 years, earnings growth has had 1.4x the impact of dividends on index gains. Over the last decade, earning growth has had 3.6x the impact.
Looking at the numbers overall, over the last 50 years, through the end of 2023, the S&P 500 has had a compound annual growth rate of 11.1%. 6.7% of that has come from earnings growth; 2.9% from dividends; 1.6% from multiples changes. If you take that as a percentage of the whole, 60% came from earnings growth, 26% from dividends, and 14% from multiples expansion. That means the fundamental drivers of stock returns (earnings and dividends) have accounted for 86% of returns over the last 50 years.
That doesn’t mean that the 1.6% per year that came from multiples expansion is all from sentiment. Profit margins were running at roughly 6% in 1973. In December of 2023, trailing year, they were running over 10%. That deserves a higher price multiple on a fundamental basis, reflecting the drift in the fair value multiple mentioned above.
What’s the upshot of all this? Throughout our blogs we have provided many long-term investing charts speaking to the long-run potential of stocks while offering guidance on how to handle the shorter-term volatility that can lead investors to make costly behavioral mistakes. It’s important to understand that our view is not just based on an expectation that future stock returns will mirror the past with no deeper justification. Rather, the expectation is based on the underlying fundamentals of what stock ownership means. If you believe that stocks can continue to grow earnings, then you ought to believe in stocks in the long run. In the short run there will be volatility and periods of weaker returns. But if earnings can grow, stocks will continue to have an intrinsic value that will flow through to higher returns over time.
For more content by Barry Gilbert, VP, Asset Allocation Strategist click here.
02548152-1224-A