Strikes, student loans, and shutdown have been the top 3 concerns for investors in recent weeks. Earlier this week, Ryan wrote about the government shutdown, and I discussed why the student loan payment restart may not be a huge concern. I want to tackle strikes in this post.
Strikes have been in the news recently, whether it’s the Hollywood writers’ strike, actors strike, or the United Autoworkers (UAW) strike. The UAW strike has caught a lot of attention, with both President Biden and former President Trump taking a trip out to Detroit to meet autoworkers.
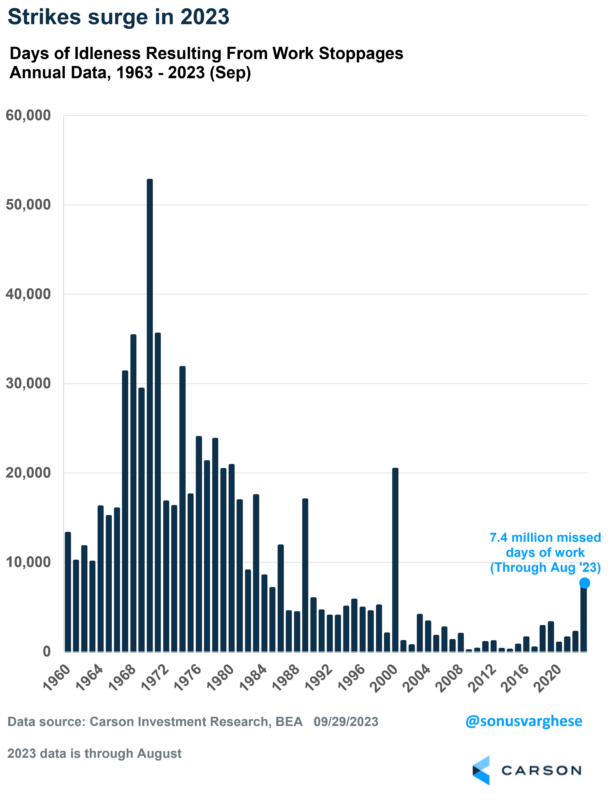
If you’re sensing that there seem to be more strikes these days, you’d be right. Data from the Bureau of Labor Statistics indicates that large work stoppages have resulted in more than 7 million missed days of work through August of this year. That’s significantly more than any year since 2000. The average from 2001 through 2022 was just 1.5 million. In 2000, we had 135,000 striking TV/Radio artists and actors that did not work for six months (May through October). Before that, you had to go all the way back to the late 1980’s, to see as many missed days of work as we have this year.
Strikes don’t happen in a vacuum. They occur when workers decide that they have enough leverage over management to extract more favorable pay and benefits. That leverage usually comes about only when labor markets are “tight,” i.e. when unemployment is low and it’s not easy for companies to find workers (or its more expensive to find and train them). This should sound familiar because that’s probably a good description of the labor market today.
This Is a Different Labor Market
The labor market we’re currently experiencing is one that is very different from what we experienced over the last couple of decades. Here’re some numbers:
- The unemployment rate is at 3.8%, which is not far from 50-year lows of 3.4%. The average unemployment rate across all economic expansions since 1948 is 5.6%.
- The employment-population ratio for prime-age workers (25-54) is at 80.9%, the highest in more than 20 years. For women, it’s at a record 75.3%.
- The number of job openings per unemployed worker (a measure of labor demand vs supply) is at 1.6. That’s much higher at any point over the last 2 decades.
- Average hourly earnings for private workers have been rising at a 4.5% annualized pace over the past 3 months. That is faster than the 3.1% pace we saw before the pandemic from Jan 2019 through Feb 2020.
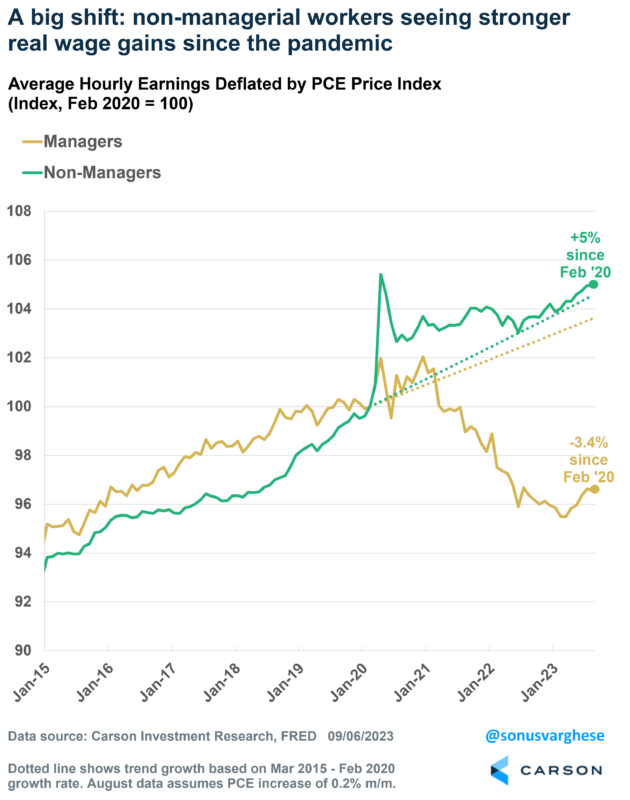
The labor market is also working better for lower-wage workers, who tend to spend relatively more of their incomes. Income growth, even after adjusting for prices, has been much stronger for “production and non-supervisory” workers, i.e. non-managers, than for managers. Non-managers make up about 81% of the private workers.
Over the five years prior to the pandemic, inflation-adjusted (“real”) average hourly earnings for managers grew at an annual pace of 1%. Real income growth for non-managers grew slightly faster, running at a 1.3% annual pace. There’s been a stark shift since the pandemic. Real incomes for non-managers have grown 5% since Feb 2020 (through August 2023), translating to an annual pace of 1.4% and slightly higher than the pre-pandemic trend. However, real incomes have fallen more than 3% for managers (-1% annualized)!

Stay on Top of Market Trends
The Carson Investment Research newsletter offers up-to-date market news, analysis and insights. Subscribe today!
"*" indicates required fields
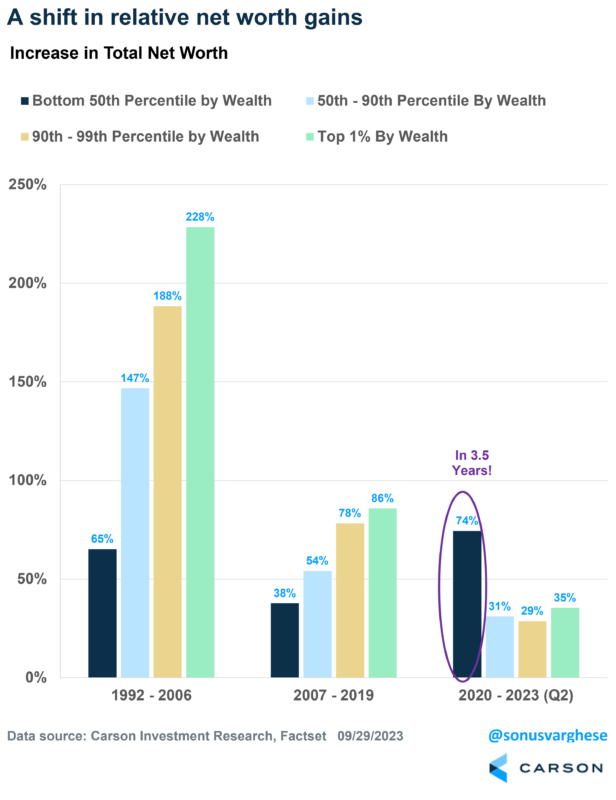
Here’s another sign that this economy is working very differently than the one we saw over the past few decades. From January 2020 through June 2023, net worth of households in the bottom 50% by wealth has increased 74%, mostly thanks to rising home prices. That is more than the pace of increase for wealthier households, as you can see in the chart below.
I don’t mean to deny that inequality remains high. At the same time, the share of total net worth held by the bottom 50% has increased from 1.9% in 2019 to 2.5% as of June 2023, the highest share since 2005 outside of early 2022.
Also noteworthy, the pace of net worth growth since 2020 for the bottom 50% is larger than what we saw from 2007 through 2019 and even over the 15 years from 1992 through 2006.
The last decade was rough. Real estate makes up the bulk of assets for households in the bottom 50%, and the housing crash put a huge dent in the net worth of these households. On the other hand, wealthier households have a significant portion of their wealth in the stock market and hence saw net worth grow much faster over the last few decades.
The period after the Great Financial Crisis (GFC) in 2008 was one where households had to repair their personal balance sheets after a massive real estate and stock market crash. Savings rates rose as a result, and there was relatively less spending. That is why the economy didn’t grow as fast.
We’re in a very different place right now. Household net worth fully recovered from its post-GFC pullback by 2019. Government transfers during the pandemic further boosted spending power. The pandemic did create a shortage of labor, which was then exacerbated by companies looking to hire even more workers to meet higher demand. In fact, consumption is still running higher than its pre-pandemic trend.
All these factors have created an environment that is much more favorable for workers. The strikes we are seeing now are simply a symptom of a strong labor market, something we haven’t experienced in a few decades. Perhaps it shouldn’t be surprising why the economy has remained strong despite higher interest rates. So much so that it continues to confound most economic forecasters, including the Federal Reserve (Fed), who only recently became more bullish about the economy. My colleague, Barry Gilbert recently wrote about the economy’s resilience in the face of an aggressive Fed.
Coming back to strikes, don’t be too surprised if you see a few more of these before the year is out. The good news is that they look likely to get resolved sooner rather later. The Hollywood writers’ strike is over, and even the UAW seem to be moderating their demands a bit.
For more on the latest on student loans, shutdowns, and strikes, be sure to watch our new Facts vs Feelings Take Five video with Ryan and myself below.
01919077-0923-A


