“If you don’t know where you want to get to….it doesn’t matter which way you go.” -The Cheshire Cat to Alice in Alice in Wonderland.
Stocks have continued to stage an impressive rally off the mid-March lows, so much so that we have now seen multiple rare and potentially bullish signals trigger. Today, I’ll take a look at three of these signals. Yes, by itself any one of these signals could be noise, but when you start stacking them on top of each other, like the Cheshire Cat said in the quote above, stocks likely want to go higher and we should be ready to know where they could head.
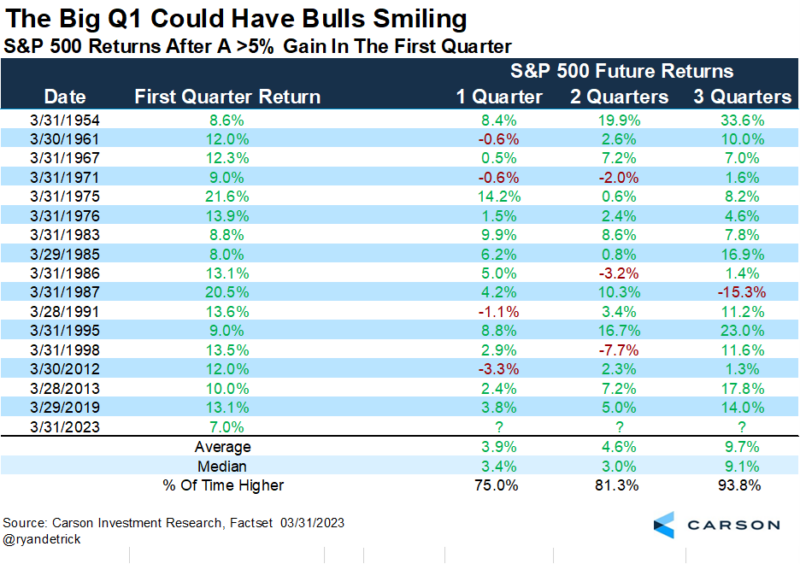
First up, the S&P 500 had it’s best first quarter since 2019, up 7.0%, which came on the heels of 7.1% gain the quarter before. What happened after previous big first quarters? I found there were 16 other first quarters that gained at least 5% and the final three quarters of the year finished higher 15 times. Yes, the one year that didn’t work was 1987 and when people hear that year, they start to get worried. Well, stocks were up 40% for the year in August back then, so we’ll worry about having another 1987 if we see returns like that (which we don’t expect). Until then, this is another clue the bulls could have a nice 2023.
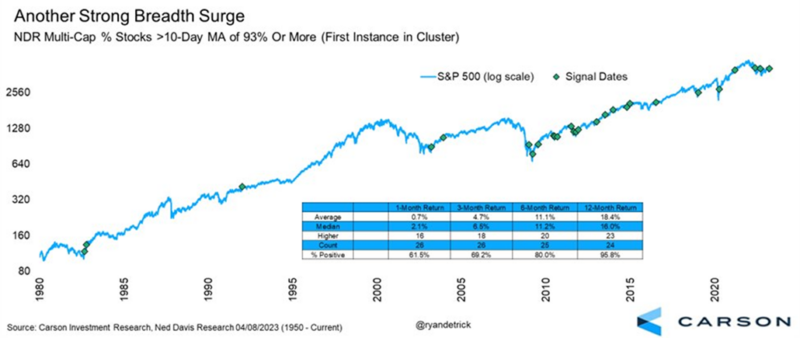
Next, we’ve heard a lot how only a few stocks are leading the overall markets higher. We don’t fully agree there and one way to show this is there was a recent sign of extreme buying pressure across many sectors and stocks. Using data from our friends at Ned Davis Research, more than 93% of the stocks in the NDR universe were recently above their 10-day moving average. All you need to know here is this is a rare sign of broad-based strength and a year later stocks were higher 23 out of 24 times with some very solid returns along the way.
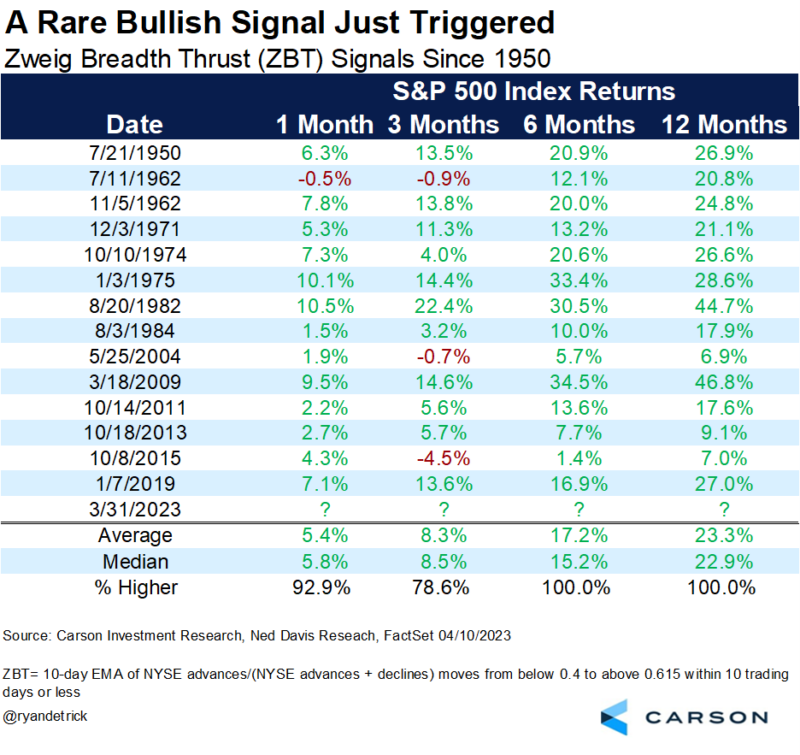
Lastly, Marty Zweig is known as one of the best traders ever and he coined the Zweig Breadth Thrust (ZBT) indicator many years ago. Well, we just saw a rare trigger of this potentially bullish signal. To keep it simple, this signal looks at all the stocks on the NYSE and it looks for periods of extreme oversold periods moving to periods of extremely overbought in a short timeframe. Think of it as a washout and then heavy buying coming in, which tends to open the door to higher prices.

Stay on Top of Market Trends
The Carson Investment Research newsletter offers up-to-date market news, analysis and insights. Subscribe today!
"*" indicates required fields
The table below shows the previous 14 ZBTs and what happened next. Wouldn’t you know it, but the S&P 500 was higher a year later every single time. That is 14 out of 14 and up 23.3% on average. Sure, the sample size isn’t probably as large as we’d like to consider this statistically relevant, but I’d sure rather know this than ignore it.
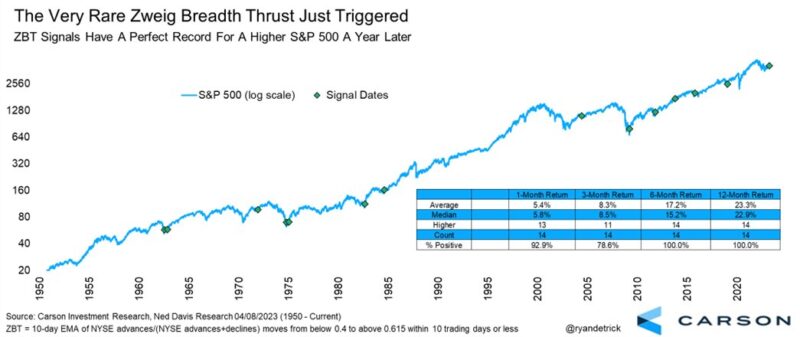
Finally, here’s a chart showing the ZBTs. Sometimes a picture tells the story and one look at this, and it would be quite rare for this signal to trigger and for stocks to simply drop right back to new lows. In fact, usually it happens ahead of periods of strength.
For more of our thoughts on these signals and the latest on the macro backdrop, be sure to listen to the latest Facts vs Feeling podcast with Sonu and myself.
Apple Podcast | Google Podcast | Spotify


