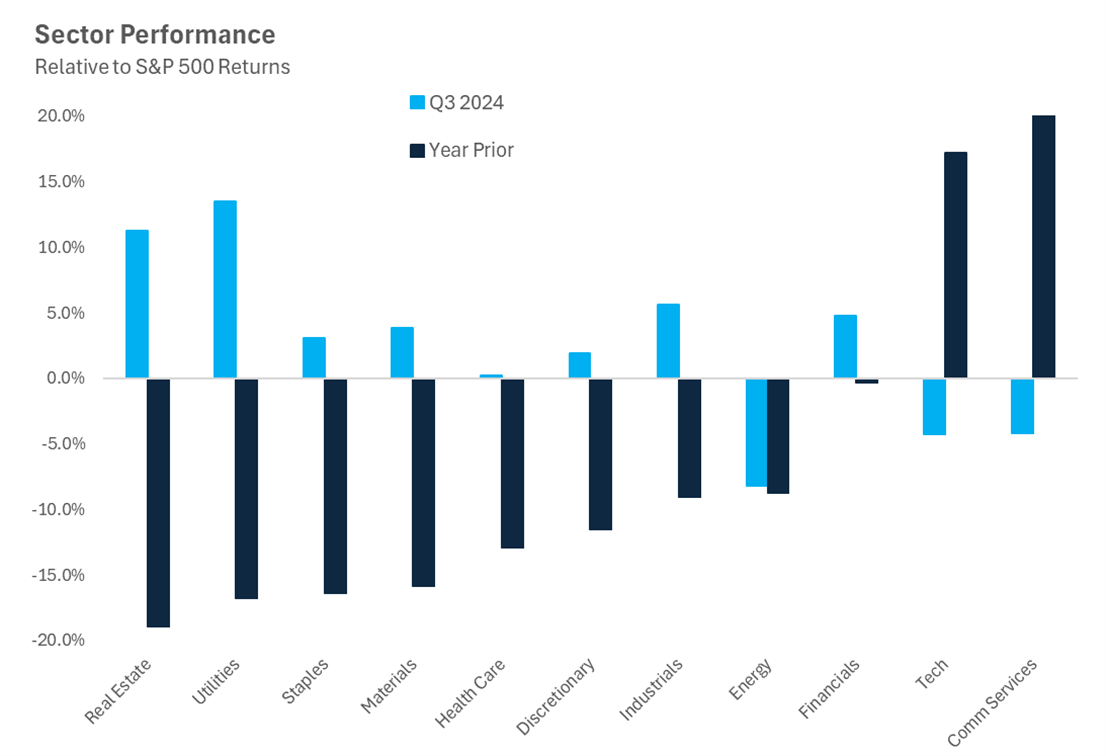
The third quarter was a very strong one for markets, but in a different way than we have seen in recent periods. Leadership changed, often catching some managers off guard, but showing the broadening strength of this bull market. The chart below shows this simplistically, with the returns from Q3 in light blue, compared with the return the prior 12 months (ending 6/30/2024) — a common momentum period. With almost uncanny uniformity outside of energy stocks, the winners from the prior year reversed in Q3 as interest rates fell and bond prices jumped. Even Nvidia, almost impossible to avoid mentioning in any stock market related commentary, fell slightly (after returning 192% the prior year) for the first negative quarter in two years.
Sources: Carson Investment Research, Morningstar 9/30/2024
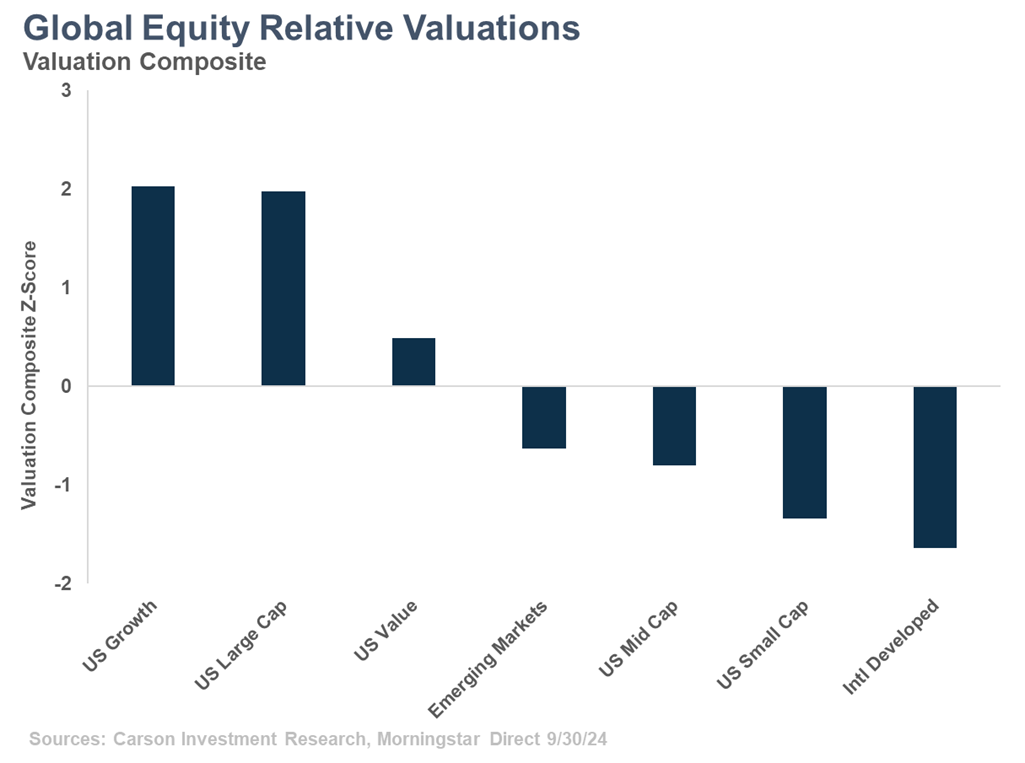
At the start of a new quarter and the prior quarter’s corporate earnings season, a check on valuations is in order. As to be expected with valuations, looking back 25 years not too much has changed. That being said, when the market appears to rotate, valuations can become a more important signal. The story remains broadly the same — US large cap stocks, led by growth names, trade at richer valuations relative to the overall market than they have in the past. This naturally makes other areas of the market look less expensive in a relative sense based on how much of the market these mega caps command. This differential has widened further year to date, with US small cap and developed international names appearing the most attractively valued. Between the two, small caps appear to be clear beneficiaries of the market rotation and decline in interest rates. One thing to note is that emerging markets remain undervalued relative to the market and their history, which has been the case now for more than a decade, but they aren’t even close to the most undervalued areas of the market. The potential fat pitch for EM for many years has been that valuation benefit, and that is less obvious at this point.
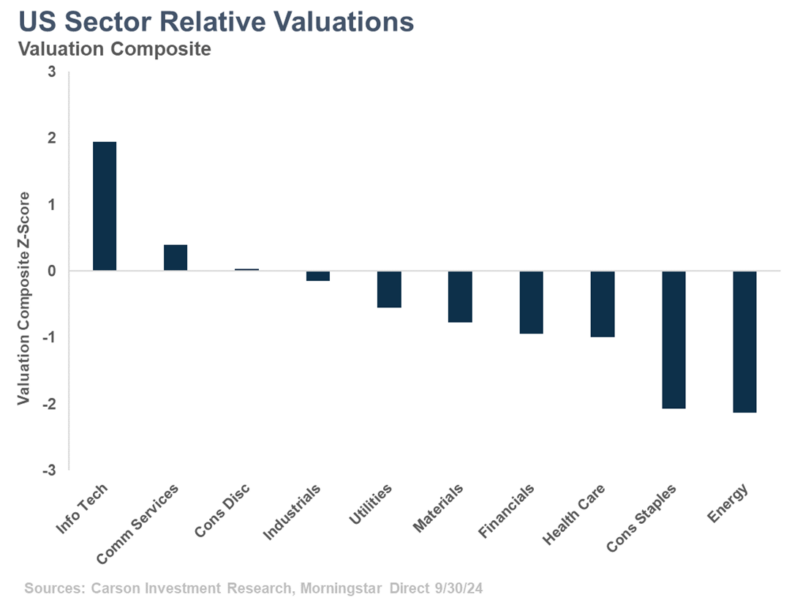
On the sector side, tech is notably commanding market valuations at two standard deviations above its historical market-relative average. To put that in perspective, the height of the tech bubble saw those valuations climb to the equivalent of 2.5 standard deviations above average. Now before anyone goes crying bubble, the earnings story is significantly different now than it was back then, and A.I. may demand a higher multiple than we’ve ever seen before. The two richest sectors from a valuation perspective are also expected to grow their earnings the fastest in the coming quarters, so there is a chance to grow into at least some of those lofty valuations.
Energy and staples have very low earnings growth expectations and are valued as such, whereas healthcare is expected to show earnings growth recovery and financials have already been off to a strong start this earnings season. Utilities, typically a boring bond proxy, are showing actual signs of real growth tied to data centers and infrastructure expansion and have been rerated higher away from the typical defensive sectors.

Stay on Top of Market Trends
The Carson Investment Research newsletter offers up-to-date market news, analysis and insights. Subscribe today!
"*" indicates required fields
The typical warning-sticker will be repeated here — valuations are not a timing tool by any means. A variety of factors, such as economic backdrop, fundamentals, price momentum and relative strength, and policy, all effect securities in different ways and deserve representation when analyzing any investment. However, having valuations at your back can be helpful when making investment decisions for the long run, and in the short run (like last quarter!) the market can very quickly move in favor of those with a balanced approach. There’s still a case for diversification, even within equities.
For more content by Grant Engelbart, VP, Investment Strategist click here.
02466248-1001-A


