“What is it about August?” George H.W. Bush after his second consecutive summer vacation was disrupted in August, once when Iraq invaded Kuwait and the other the 1991 Soviet Union coup
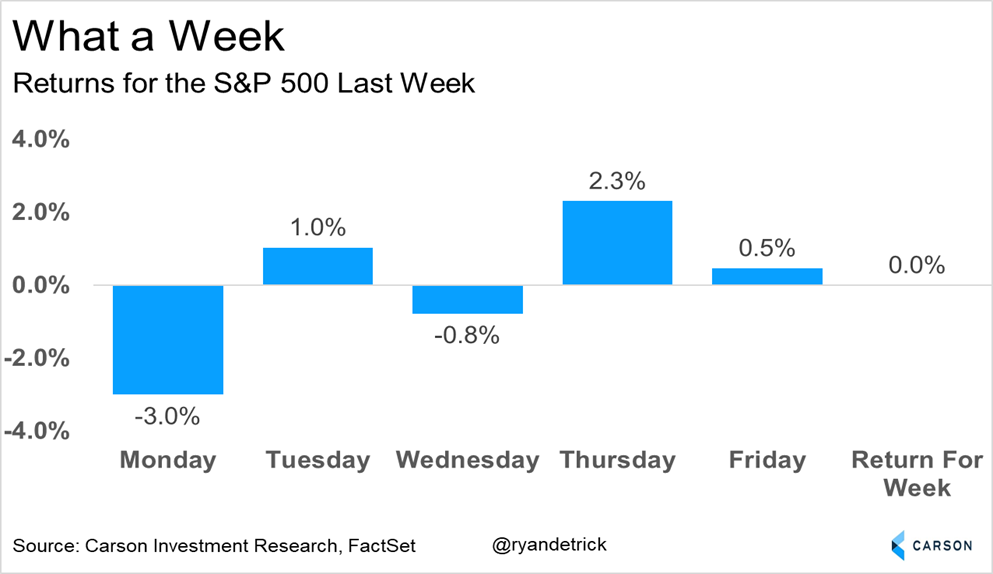
Are we having fun yet? Last week saw some of the most volatility we’ve seen in years, with the S&P 500 down 3% on Monday, the worst day since September 2022, only to then see a huge surge on Thursday for the best day since November 2022. In the end? The S&P 500 was down a whole two points and virtually flat on the week. 😕
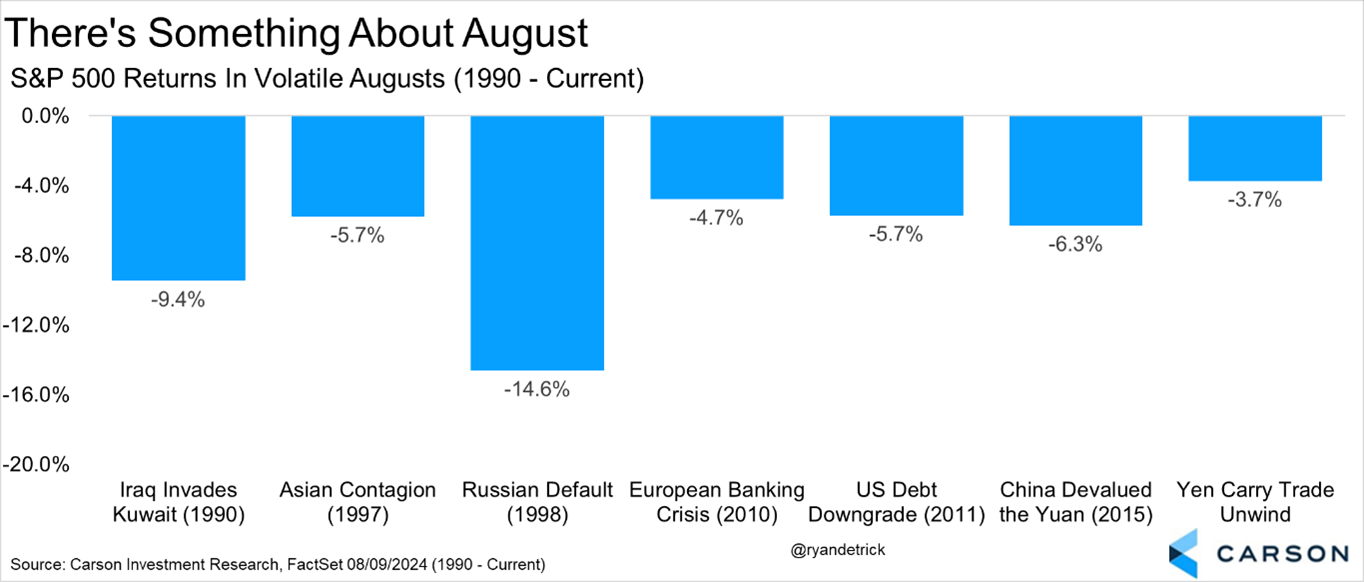
So is this weakness in August really a big surprise? Well, if we look back at history we shouldn’t be too surprised. Going back to 1990 when Iraq invaded Kuwait, big market-moving news and events have taken place in this month time and time again, from 1997 and the Asian contagion, to 1998 and the Russian default, to 2010 and the European bank crisis, to 2011 and the US debt downgrade, to 2015 and the surprise Chinese yuan devaluation, to the yen carry trade of 2024. Below is a list of those events showing how big drops in August have been perfectly normal. And let’s not forget that as bad as these all felt at the time, we did get past each of them.
The logical question is why? Listen, these big international events often coming up in August could be random, but I do think there could be something to a lot of the big money managers being on vacation this month. Then when big news comes out, you tend to get larger moves than would happen otherwise, as trading teams scramble and emotions are higher than normal with so many away. Whatever the reason, I just like to say I’d rather know than not know that August can be a month with big news.
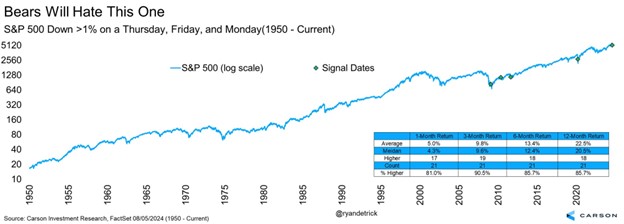
We don’t need to rehash it all here, but what sparked the losses was worry over the Federal Reserve (Fed) being behind the curve on rate cuts, concerns over the economy slowing, and the unwind of the yen carry trade. We broke it all down in 10 Talking Points About The Recent Volatility. All in all, stocks fell more than 1% on Thursday, August 1, Friday, August 2, and Monday, August 5. That on the surface doesn’t sound very good, but I found there were 21 other times this dubious feat was accomplished, and the S&P 500 was higher a year later 18 times and up more than 22% on average. Not to mention higher three months later 90% of the time!
Let’s think back to last week, when we heard many of the same bears and economists telling us the end was near and a recession was imminent. We continue to expect our economy to potentially slow, but not head into a recession. These mid-cycle slowdowns are perfectly normal and happen in most cycles. Don’t forget our second quarter Gross Domestic Product (GPD) grew at 2.8% and the third quarter is expected to grow close to 3.0% as of now. That sounds like one of the best recessions ever if you ask me 😄
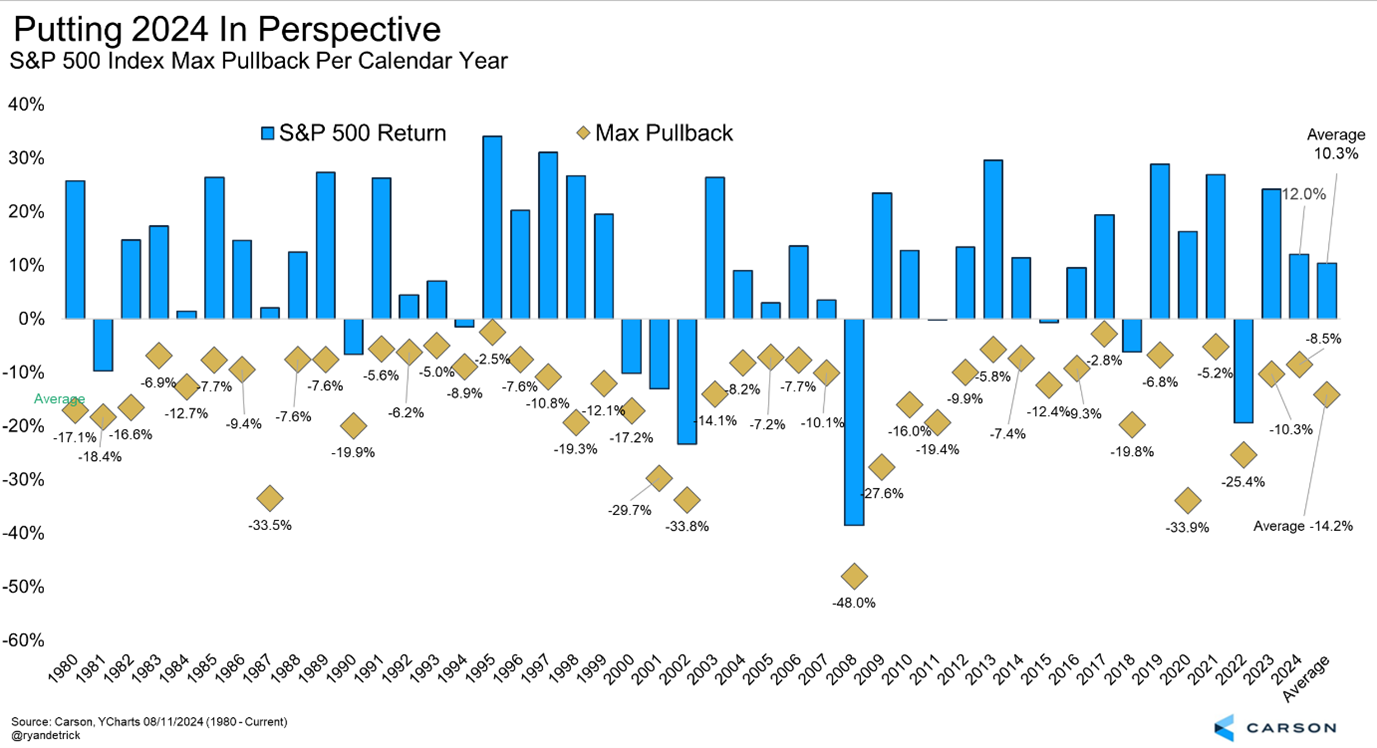
Let’s put 2024 in perspective. So far, the S&P 500 is up 12.0% for the year and it pulled back 8.5% from peak to trough, versus the average year up more than 10% with a peak-to-trough correction of 14.2% on average. In other words, that doesn’t sound all that out of the ordinary. Yes, the year is far from over, but really nothing unusual has happened so far.
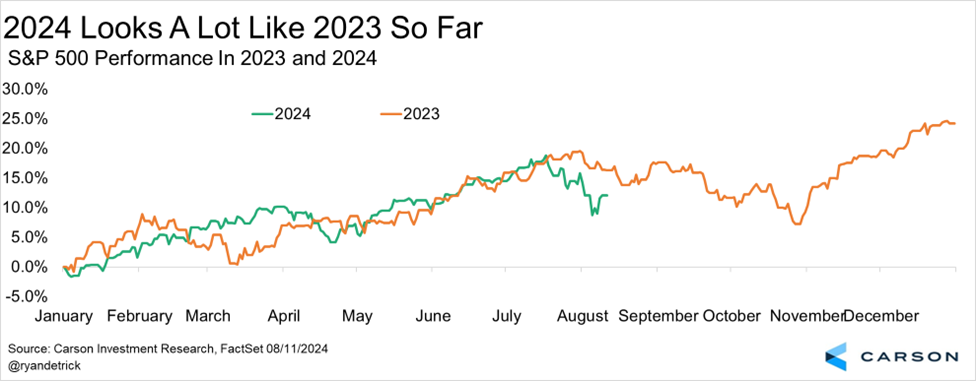
I found this one quite interesting. So far, 2024 looks a lot like 2023. Like, a lot like 2023. Who knows what happens from here, but I think it is so important to remember that we saw a 10% correction last year and stocks still gained 25%. So, any more weakness over the coming weak seasonal period of August – October doesn’t mean all hope is lost and a year-end rally is still quite possible.
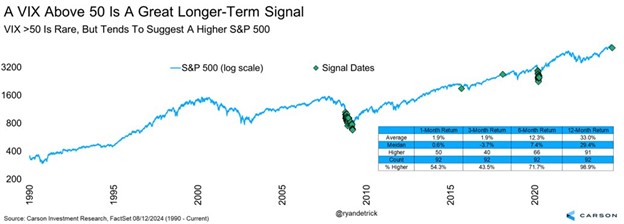
The last thing I wanted to examine was the action from the Volatility Index (VIX). This is an options-based (complicated) measure of potential volatility over the coming 30 days. Many use it as a ‘fear gauge’ and when it spikes like last week, that shows a lot of fear.
Well, it soared to nearly 66 last week, which was the third highest level ever, with only the Great Financial Crisis (GFC) and the early pandemic sell-off higher. To think we saw this spike in fear and volatility because the Bank of Japan hiked rates slightly is kind of ridiculous when you think of it like that.
Stay on Top of Market Trends
The Carson Investment Research newsletter offers up-to-date market news, analysis and insights. Subscribe today!
"*" indicates required fields
But what does a large VIX spike mean? I found there were 92 other times the VIX soared above 50 during the trading day and a year later the S&P 500 was higher 91 times. Yes, many of those took place in clusters. Still the bottom line is when fear was rampant similar to last Monday, longer-term investors needed to focus on the potential positive and contrarian bullish signal this can be.
I joined Morgan Brennan on CNBC’s Closing Bell Overtime yesterday to discuss many of these ideas and concepts. You can watch that fun interview here.
For more content by Ryan Detrick, Chief Market Strategist click here.
2364288-0824-A