“It’s not what you look at that matters, it’s what you see.” -Henry David Thoreau

Stay on Top of Market Trends
The Carson Investment Research newsletter offers up-to-date market news, analysis and insights. Subscribe today!
"*" indicates required fields
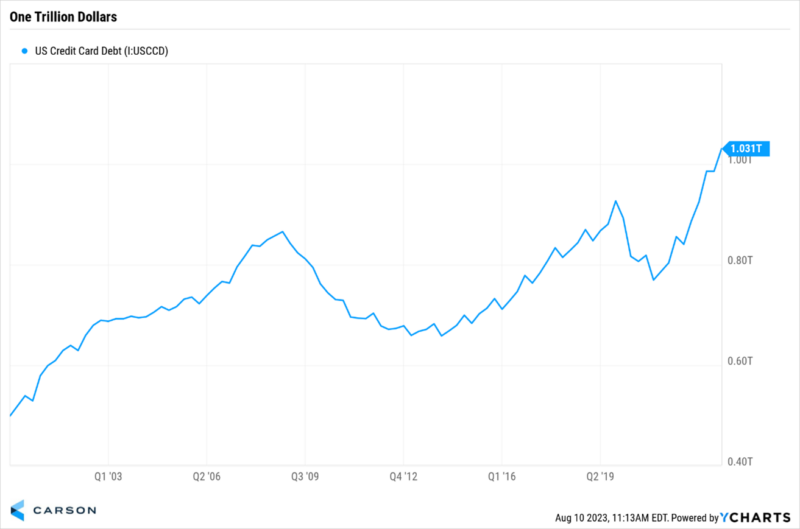
It finally happened, US consumers officially have more than $1 trillion in credit card debt, an all-time record. Not surprisingly, many claimed this was a sign the consumer was tapped out and simply spending and buying everything on credit cards. We don’t think it is that simple, in fact, we’d take the other side that this isn’t a major warning sign and the consumer is still quite healthy and not up to their eyeballs in debt.
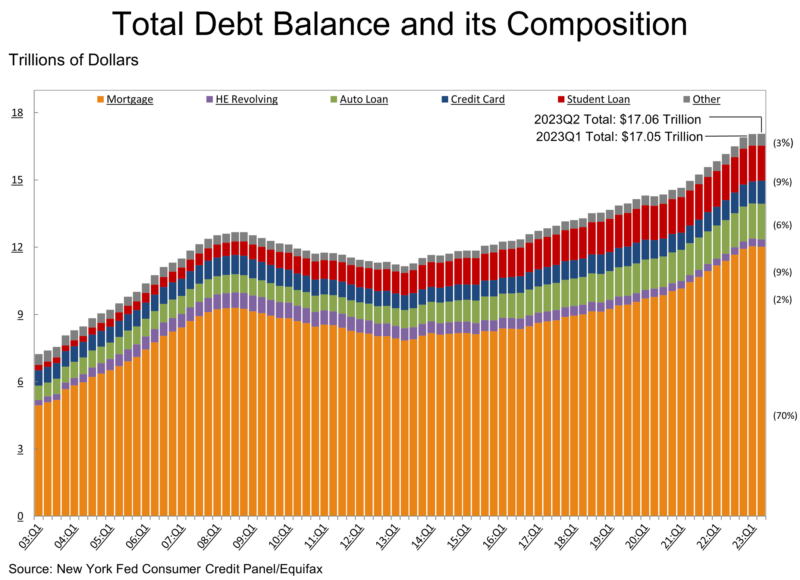
Every quarter the New York Fed releases their Quarterly Report on Household Debt and Credit, and this is the report that just showed record credit card debt. Here’s a great chart that showed overall debt reached $17.06 trillion. Peeling back the onion showed that mortgage debt stood still at $12.01 trillion as of the end of June, making up a huge part of overall debt. Credit cards were up $45 billion to $1.03 trillion, meanwhile, car loans were at $1.58 trillion and student loans checked in at $1.57 billion.
What stands out to me the most about the chart above is overall debt was virtually flat the past two quarters, from $17.05 to $17.06 trillion. Tells a much different picture than what the media makes it sound like with all the ‘soaring debt’, huh?
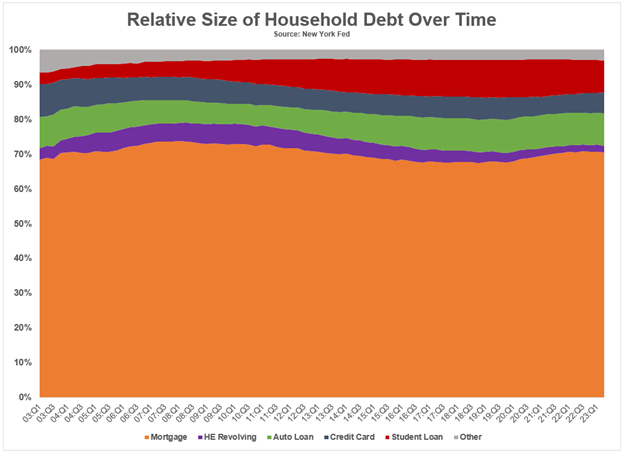
I really like the chart below from the NY Fed’s report that zooms in on the relative size of each part of debt. If you look at credit card debt specifically, it has consistently stayed in the same range over the long-term. So, credit card debt might be at a nominal record, but by no means are we seeing consumers go nuts buying everything on credit anymore than they ever have in history.
Another way to think about this is wouldn’t people likely have more credit card debt if they were worth more? I call this ‘denominator blindness’. All we hear about is the numerator at a new high, but in a lot of cases, the denominator has been soaring as well. Go read the quote at the top from Thoreau again. I love that one, as there are different ways to look at things and to me, seeing the denominator is very important.
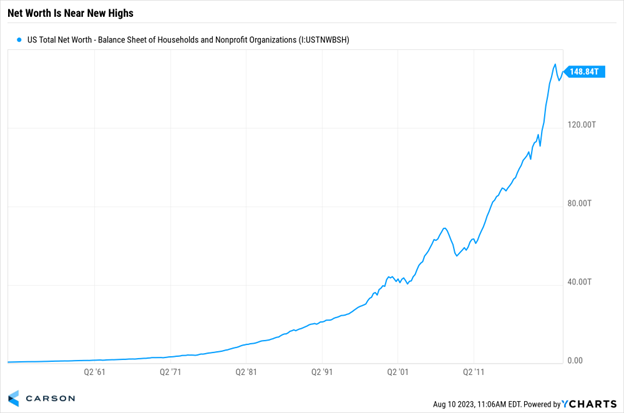
Here’s a good way to show this, overall net worth has increased significantly over time, from $44 trillion in 2000 to close to $150 trillion today. Maybe more credit debt shouldn’t be a surprise?
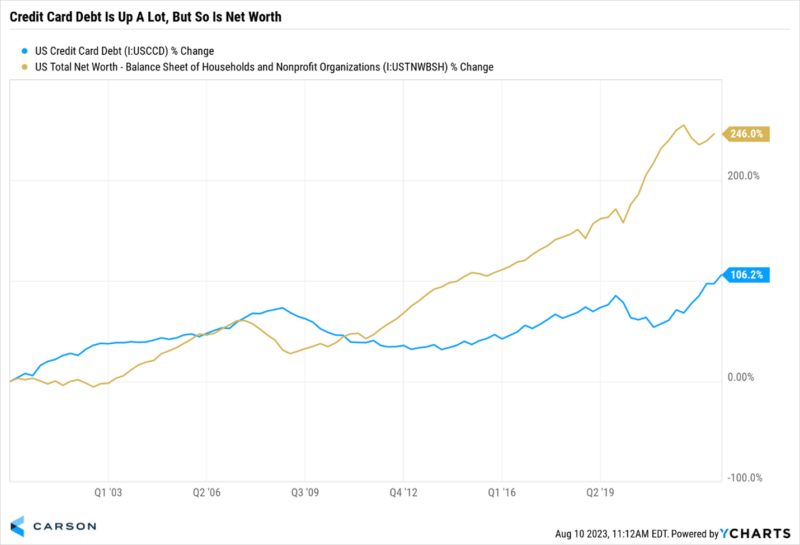
Taking that same denominator blindness approach and looking at the percentage change of credit card debts and net wealth showed a much better backdrop. Since 2000, credit card debt has gained 106%, but net worth was up close to 250%. I will say it again, maybe more credit debt shouldn’t be such a surprise?
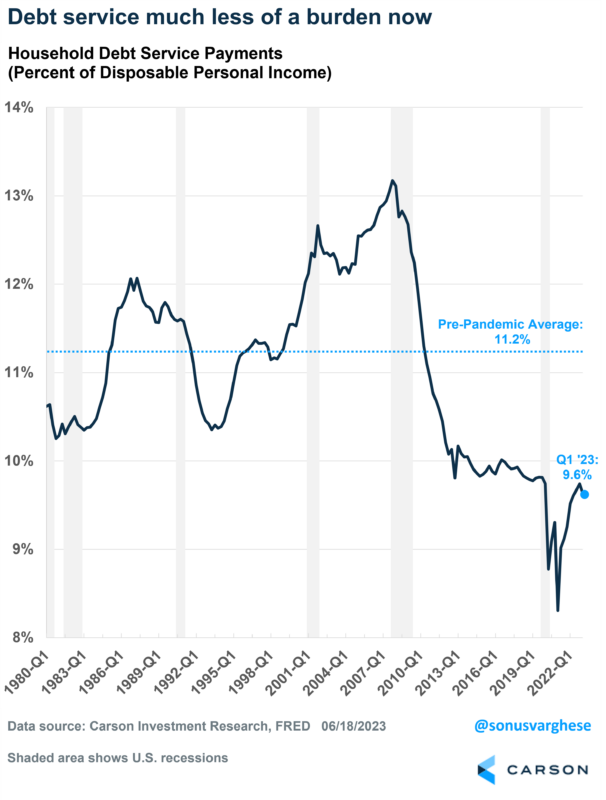
Yes, rates are higher and there’s a lot of debt, so one logical question is: can consumers pay for all this debt? Here’s a great chart showing household debt service payments as a percentage of disposable income was down to 9.6% in the first quarter, well below the pre-pandemic average of 11.2%. In simple English, there might be a lot of debt, but people are making more money so it isn’t such a stretch to service all the debt. The second quarter data isn’t out yet, but given disposable income has increased and debt likely stayed flat, this will probably fall again soon.
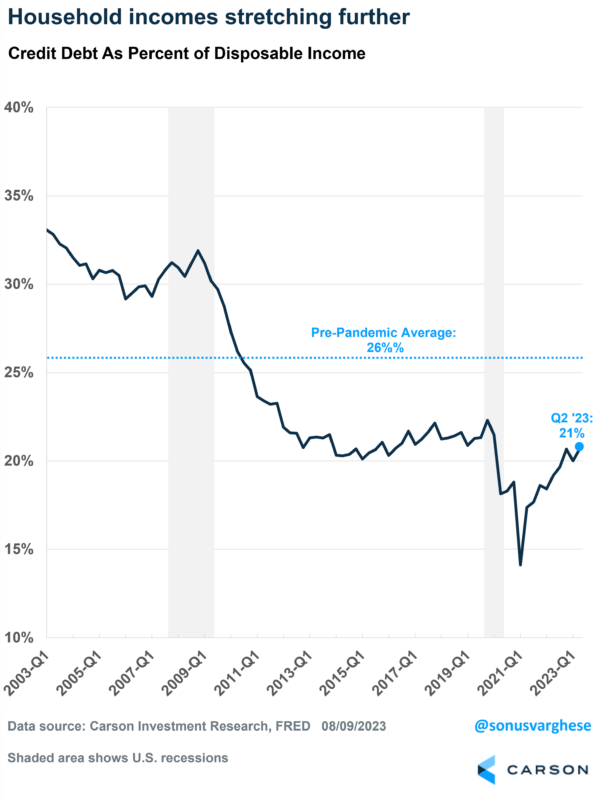
Here’s yet another way to show things aren’t as bad out there as it sounds. Credit card debt as a percentage of disposable income is 21%, still below the 22% from the end of 2019 and well beneath the 2003-2019 average of 26%. In other words, people have been making more than they have been adding to their credit cards the past few years.
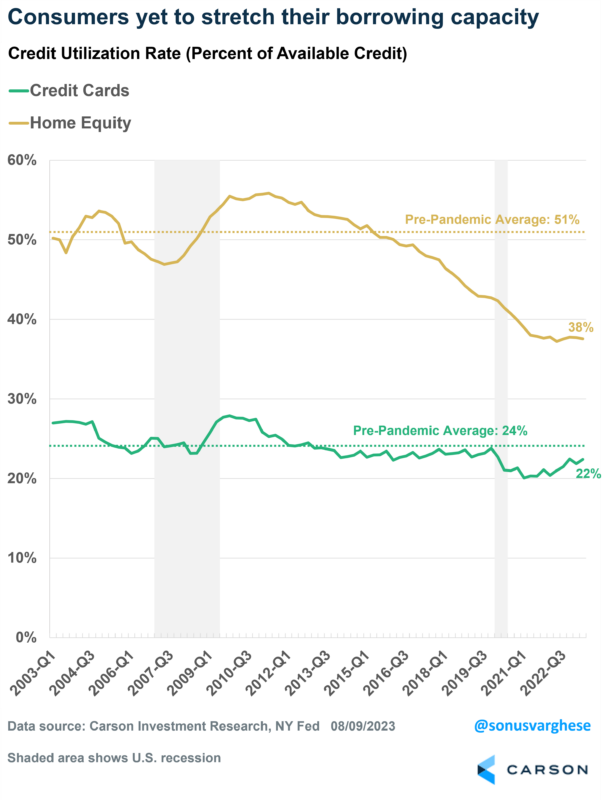
But aren’t people just maxing out their credit cards? No they aren’t is the quick and simple answer. Here’s a chart that looks at credit utilization to show what we mean. Credit utilization is how much of your credit limit you are using. Sure enough, this has held steady at 22%, compared with the pre-pandemic level of 24%. Even home equity credit utilization is running at 38%, well beneath the historical average of 51%. Again, this might shock most people who saw on the nightly news how ‘high overall debt’ has been lately. It simply isn’t true.
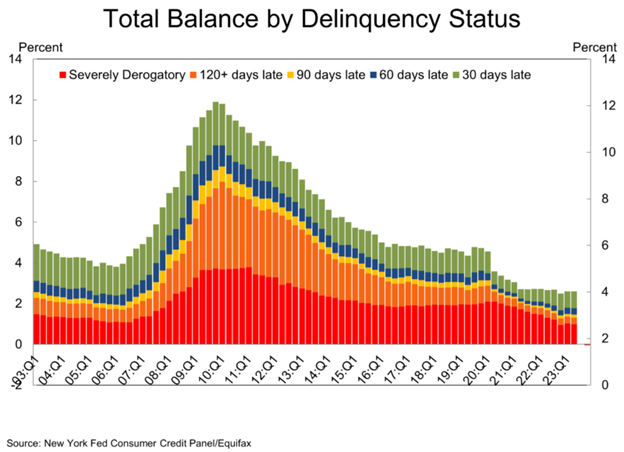
That’s enough about denominator blindness. Another thing we keep hearing is how consumers are in bad shape and the glass house is about to crack. Yet again, this just isn’t true, as delinquency balances didn’t increase last quarter, with 97.4% of total balances current on payments, unchanged from last quarter and higher than it was at the end of 2019. The chart below shows that delinquent balances that are more than 120 days late (including severely derogatory) are just 1.3% of total balances, below the 2.8% level before the pandemic.
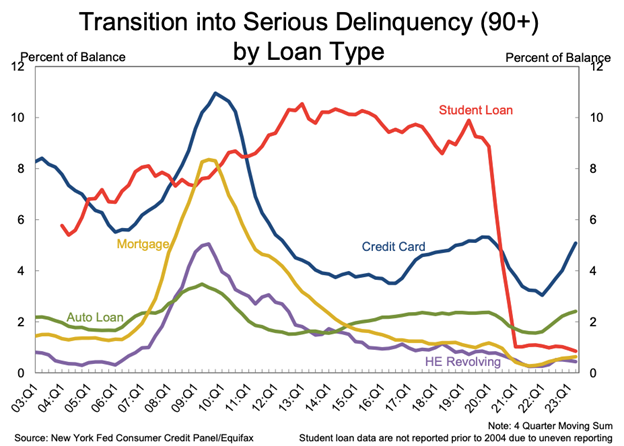
There has been a jump in serious delinquencies on credit cards, but this is also simply getting back to more normal levels. The good news is other areas haven’t jumped higher yet.
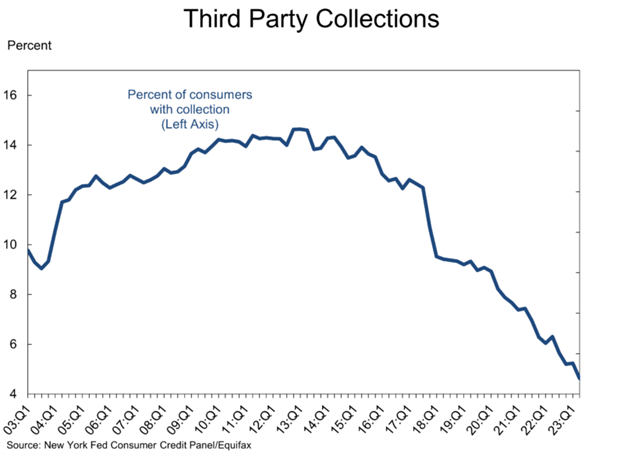
Here’s one that might shock most people, third-party collections hit an all-time low. If the consumer was in such bad shape like they keep telling us, this would probably show a much different backdrop. In fact, only 4.6% of consumers have collections against them, the lowest in history and well beneath the 6.3% from a year ago and 9.2% average through 2019.
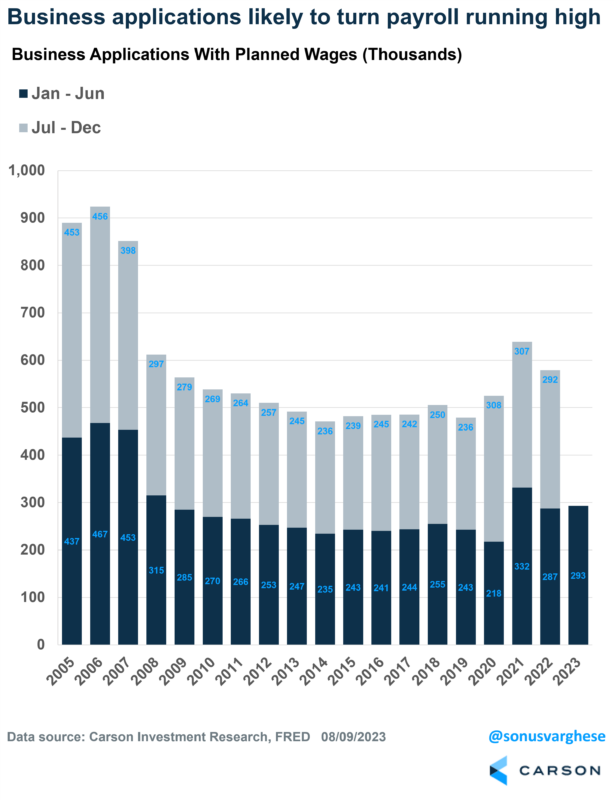
Another way of showing consumers are in better shape than they keep telling us is business applications are soaring. In other words, entrepreneurship is soaring, not something you tend to see when people are worried about paying that next bill. Nearly 300,000 applications were filed the first half of this year, 2% more than last year and 21% above 2019.
I will end this blog (which turned out to be much longer than I expected) with some help from three of my friends.
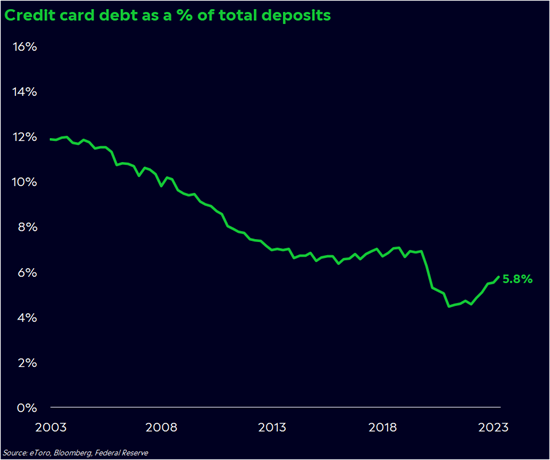
First up, Callie Cox at eToro noted that credit card debt as a percent of total bank deposits was still historically low.
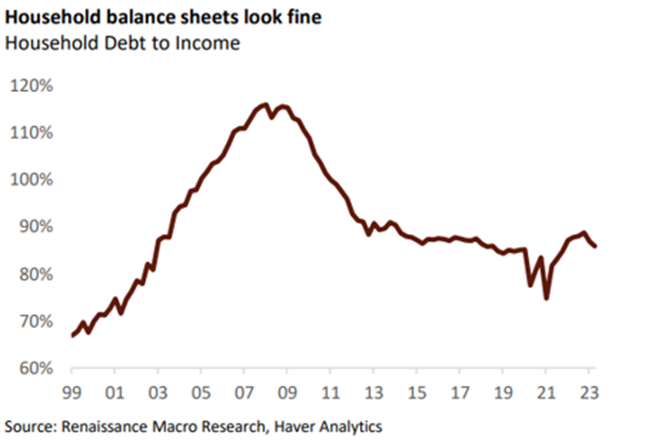
Neil Dutta at RenMac noted that household balance sheets are in fine shape, as household debt to income fell to nearly 86% in Q2, the lowest level since Q4 2021. Neil surmises that it is incomes, not debt, that are the main drivers of consumption lately.
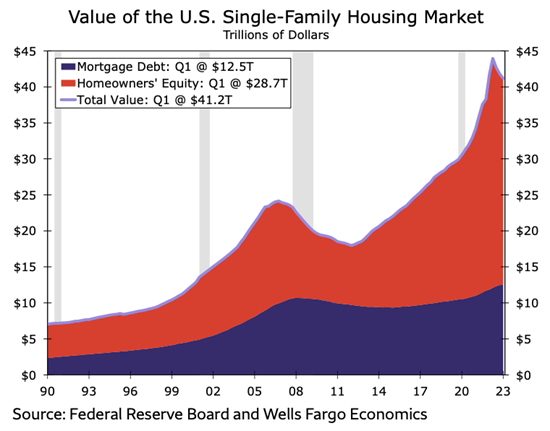
Lastly, economists at Wells Fargo in a recent note said one major positive down the road is home equity. Consumers are sitting on trillions in equity and this could help in a lot of ways over the coming years. Read their great report for more on this concept.
We are aware the headlines regarding record credit card debt, student loan forgiveness and now some talk of credit card forgiveness are causing much anxiety for investors. Our take is we doubt there will be any forgiveness plans, especially in an election year. Instead, these headlines are being used in the media to create more division, eyeballs and clicks.
The bottom line to us is the consumer remains in much better shape than the average investor realizes. Sonu and I discussed this and much more in our latest Facts vs Feelings podcast called You’re Downgraded. Enjoy!
1865691-0823-A


