The stock market has been consistently hitting new records in September and October, despite what is typically a weak seasonal period for stocks. As Ryan discussed in his latest blog, stocks have had an incredible run this year (and last year), but there are several reasons to expect the bull market to continue. Momentum begets momentum for one thing, and now we’re running into the November-January period that is historically the best consecutive three months of the year. By itself, all of this raises the odds for the rally to continue over the next few months.
But There’s Fear
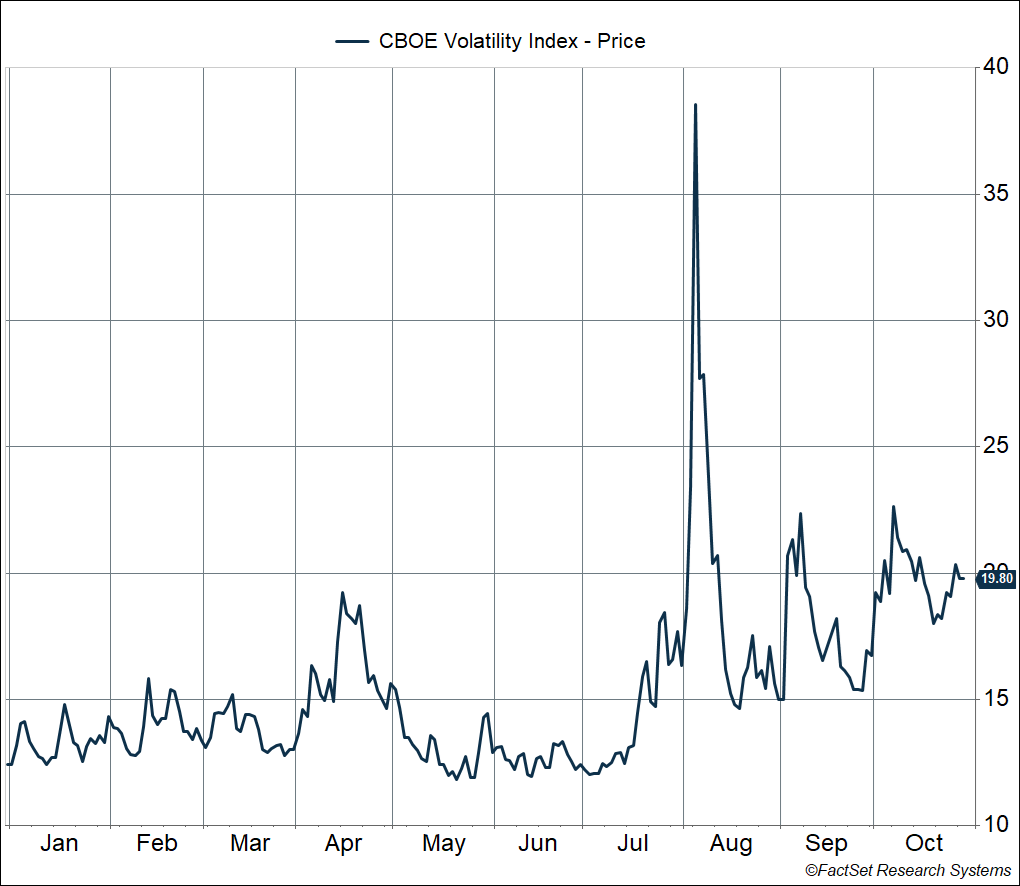
One thing that looks curious on the surface is that we’re seeing elevated volatility even as the market rallies, specifically in the “VIX” (CBOE Volatility Index). The VIX is widely regarded as the “fear gauge.” More specifically, it is the volatility that options traders expect for the S&P 500 over the next 30 days implied in options pricing. That means it’s impacted by what happens in options markets. Right now, there’s a lot of activity because of the election. Because of more “fear,” investors are buying put options on the stock market (akin to insurance on the S&P 500). This increased demand raises implied volatility, or VIX. Outside of the first week of August, the VIX is now close to the highest levels we’ve seen this year.
Elevated VIX Sows Seeds for a Post-Election Rally
When investors buy option hedges, or puts on the S&P 500, they’re essentially reducing their market exposure. At the same time, the person selling this insurance gains market exposure. These sellers are typically dealers who are not in the business of making a one-sided bet on the market (up or down). In order to neutralize the extra positive market exposure they get from selling put options, they short the index.
Fast forward to post-election. Assuming all goes well, and there’s no market pullback, a lot of these hedges (put option) are closed or expire worthless. At the same time, dealers will start to close out their shorts as well, which puts upward pressure on the index — you close out a short position by buying back the stock.
Stay on Top of Market Trends
The Carson Investment Research newsletter offers up-to-date market news, analysis and insights. Subscribe today!
"*" indicates required fields
This is why odds favor a post-election rally, especially if the VIX starts to pull back, irrespective of which candidate wins the presidency.
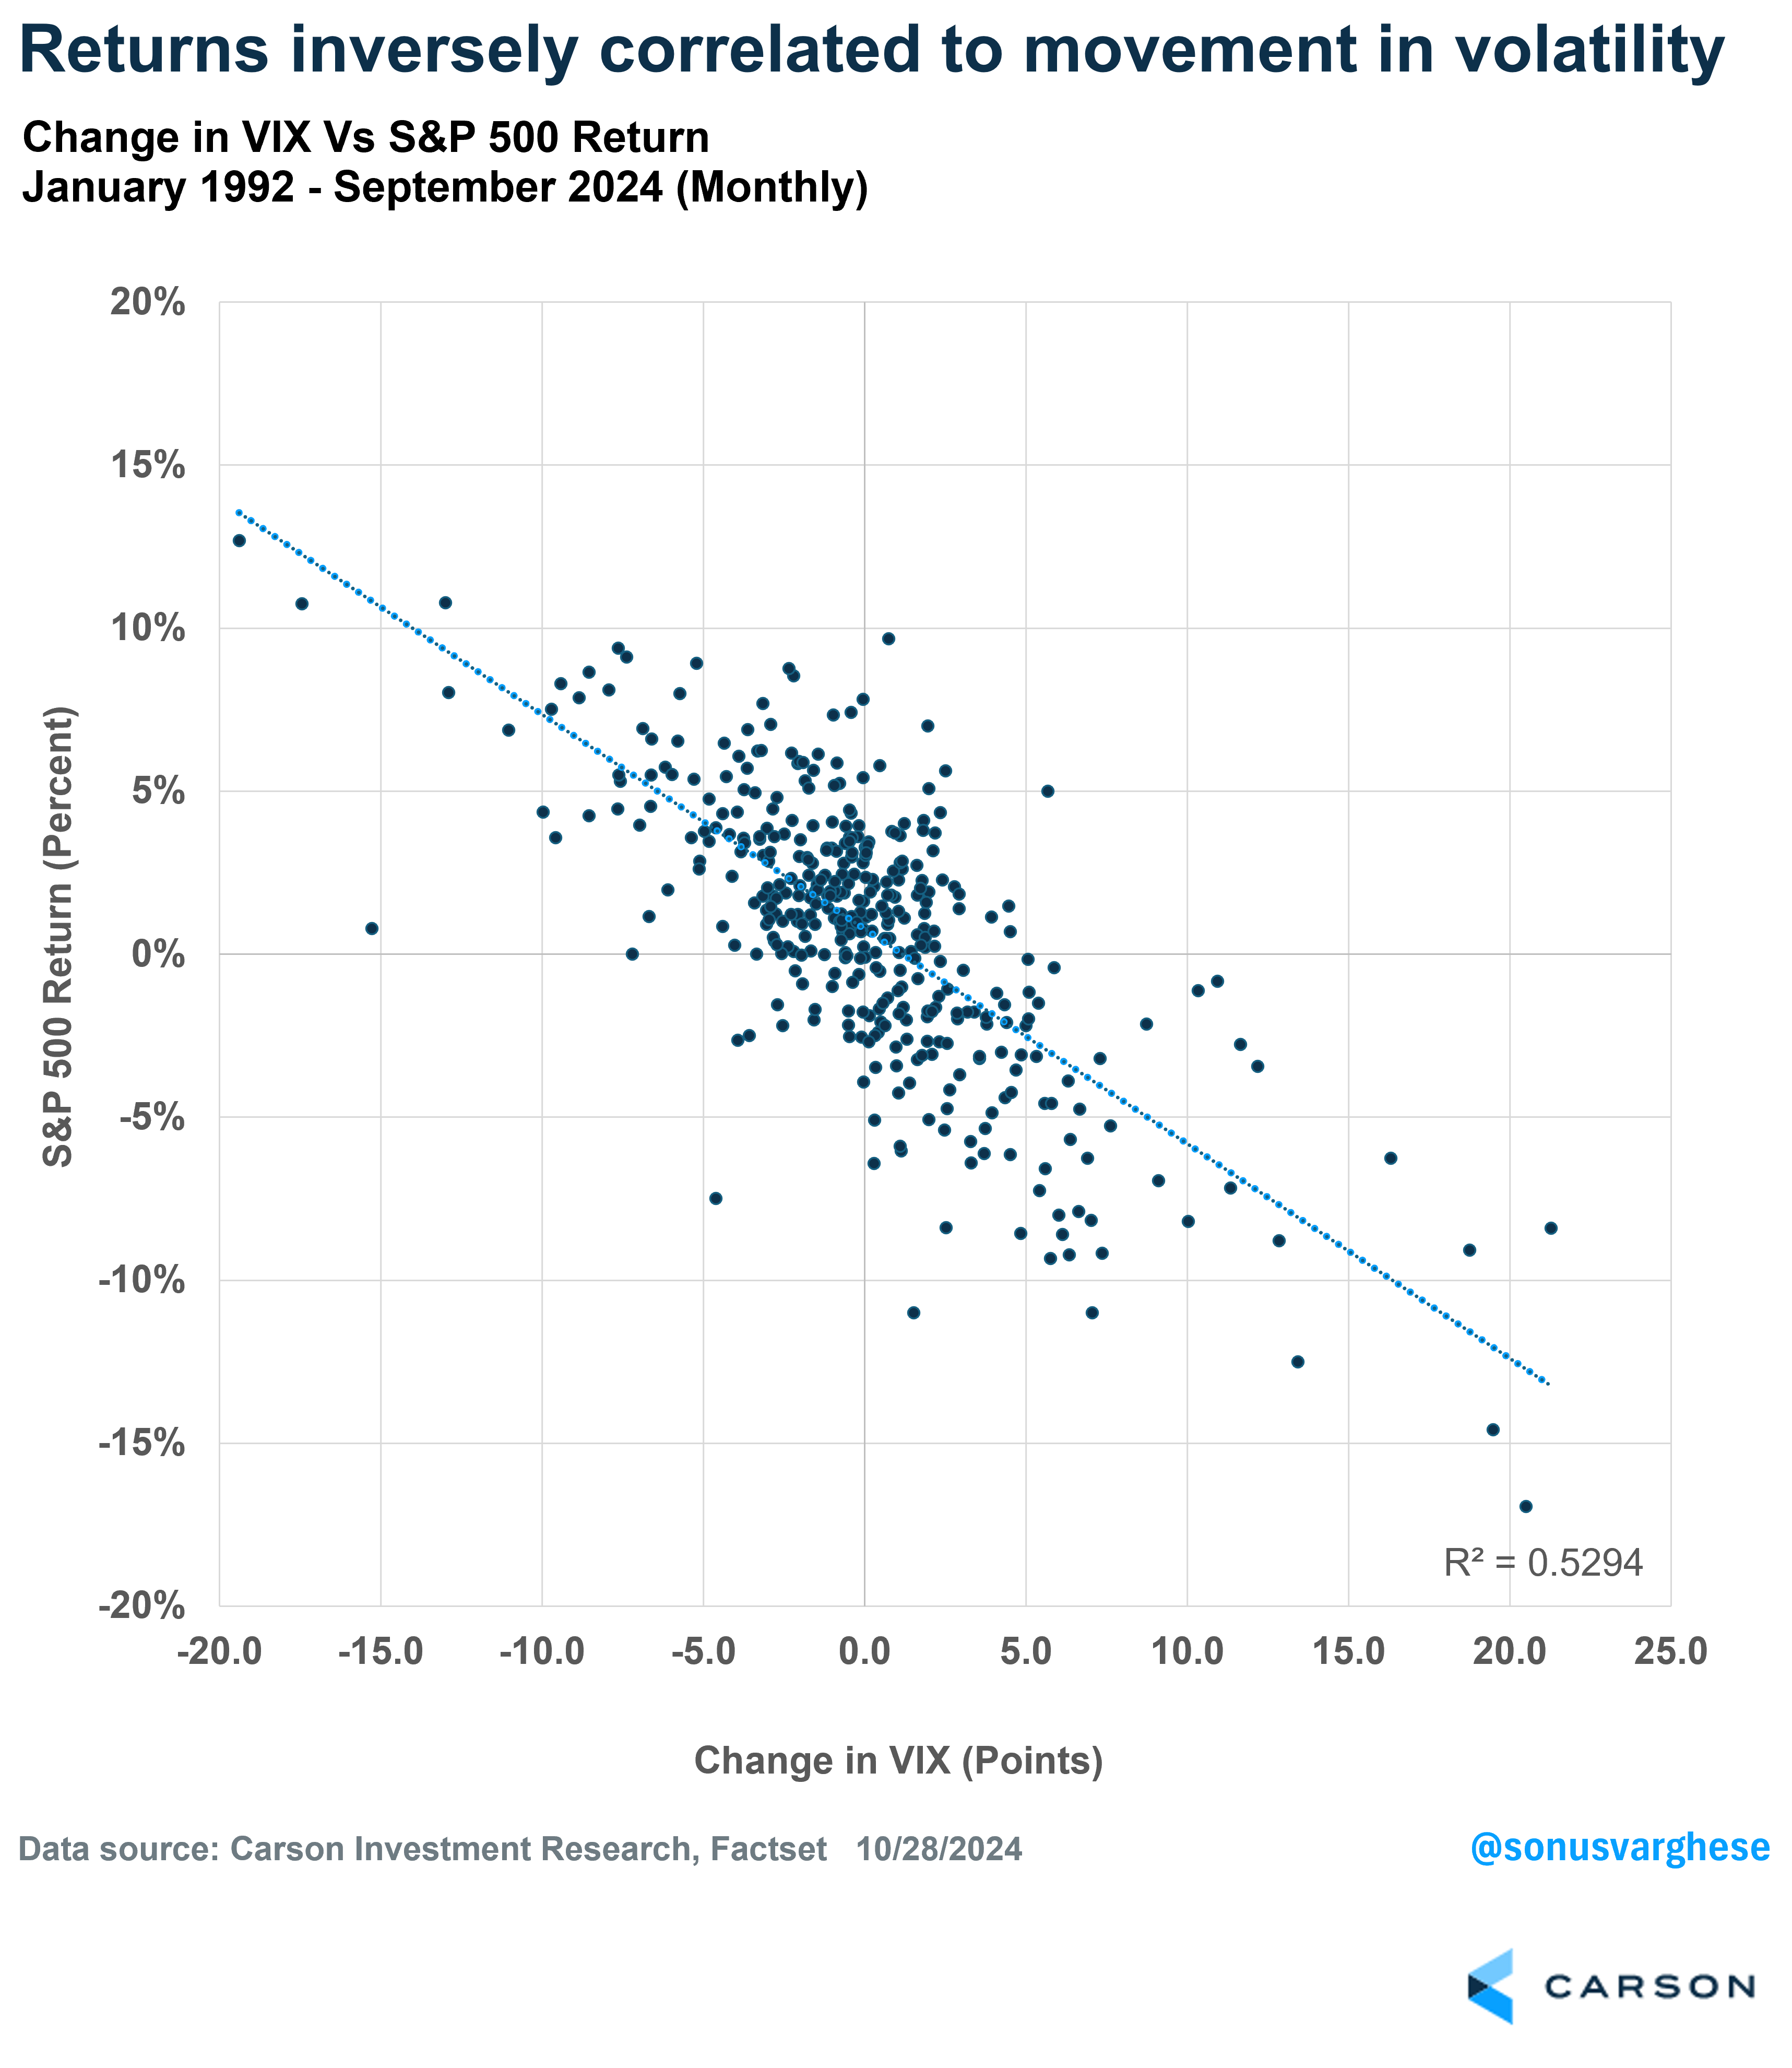
Historically, changes in VIX are inversely correlated to S&P 500 returns. When the VIX is falling, returns are higher (mostly positive). Conversely, when the VIX is rising, i.e. fear is rising, returns are mostly negative.
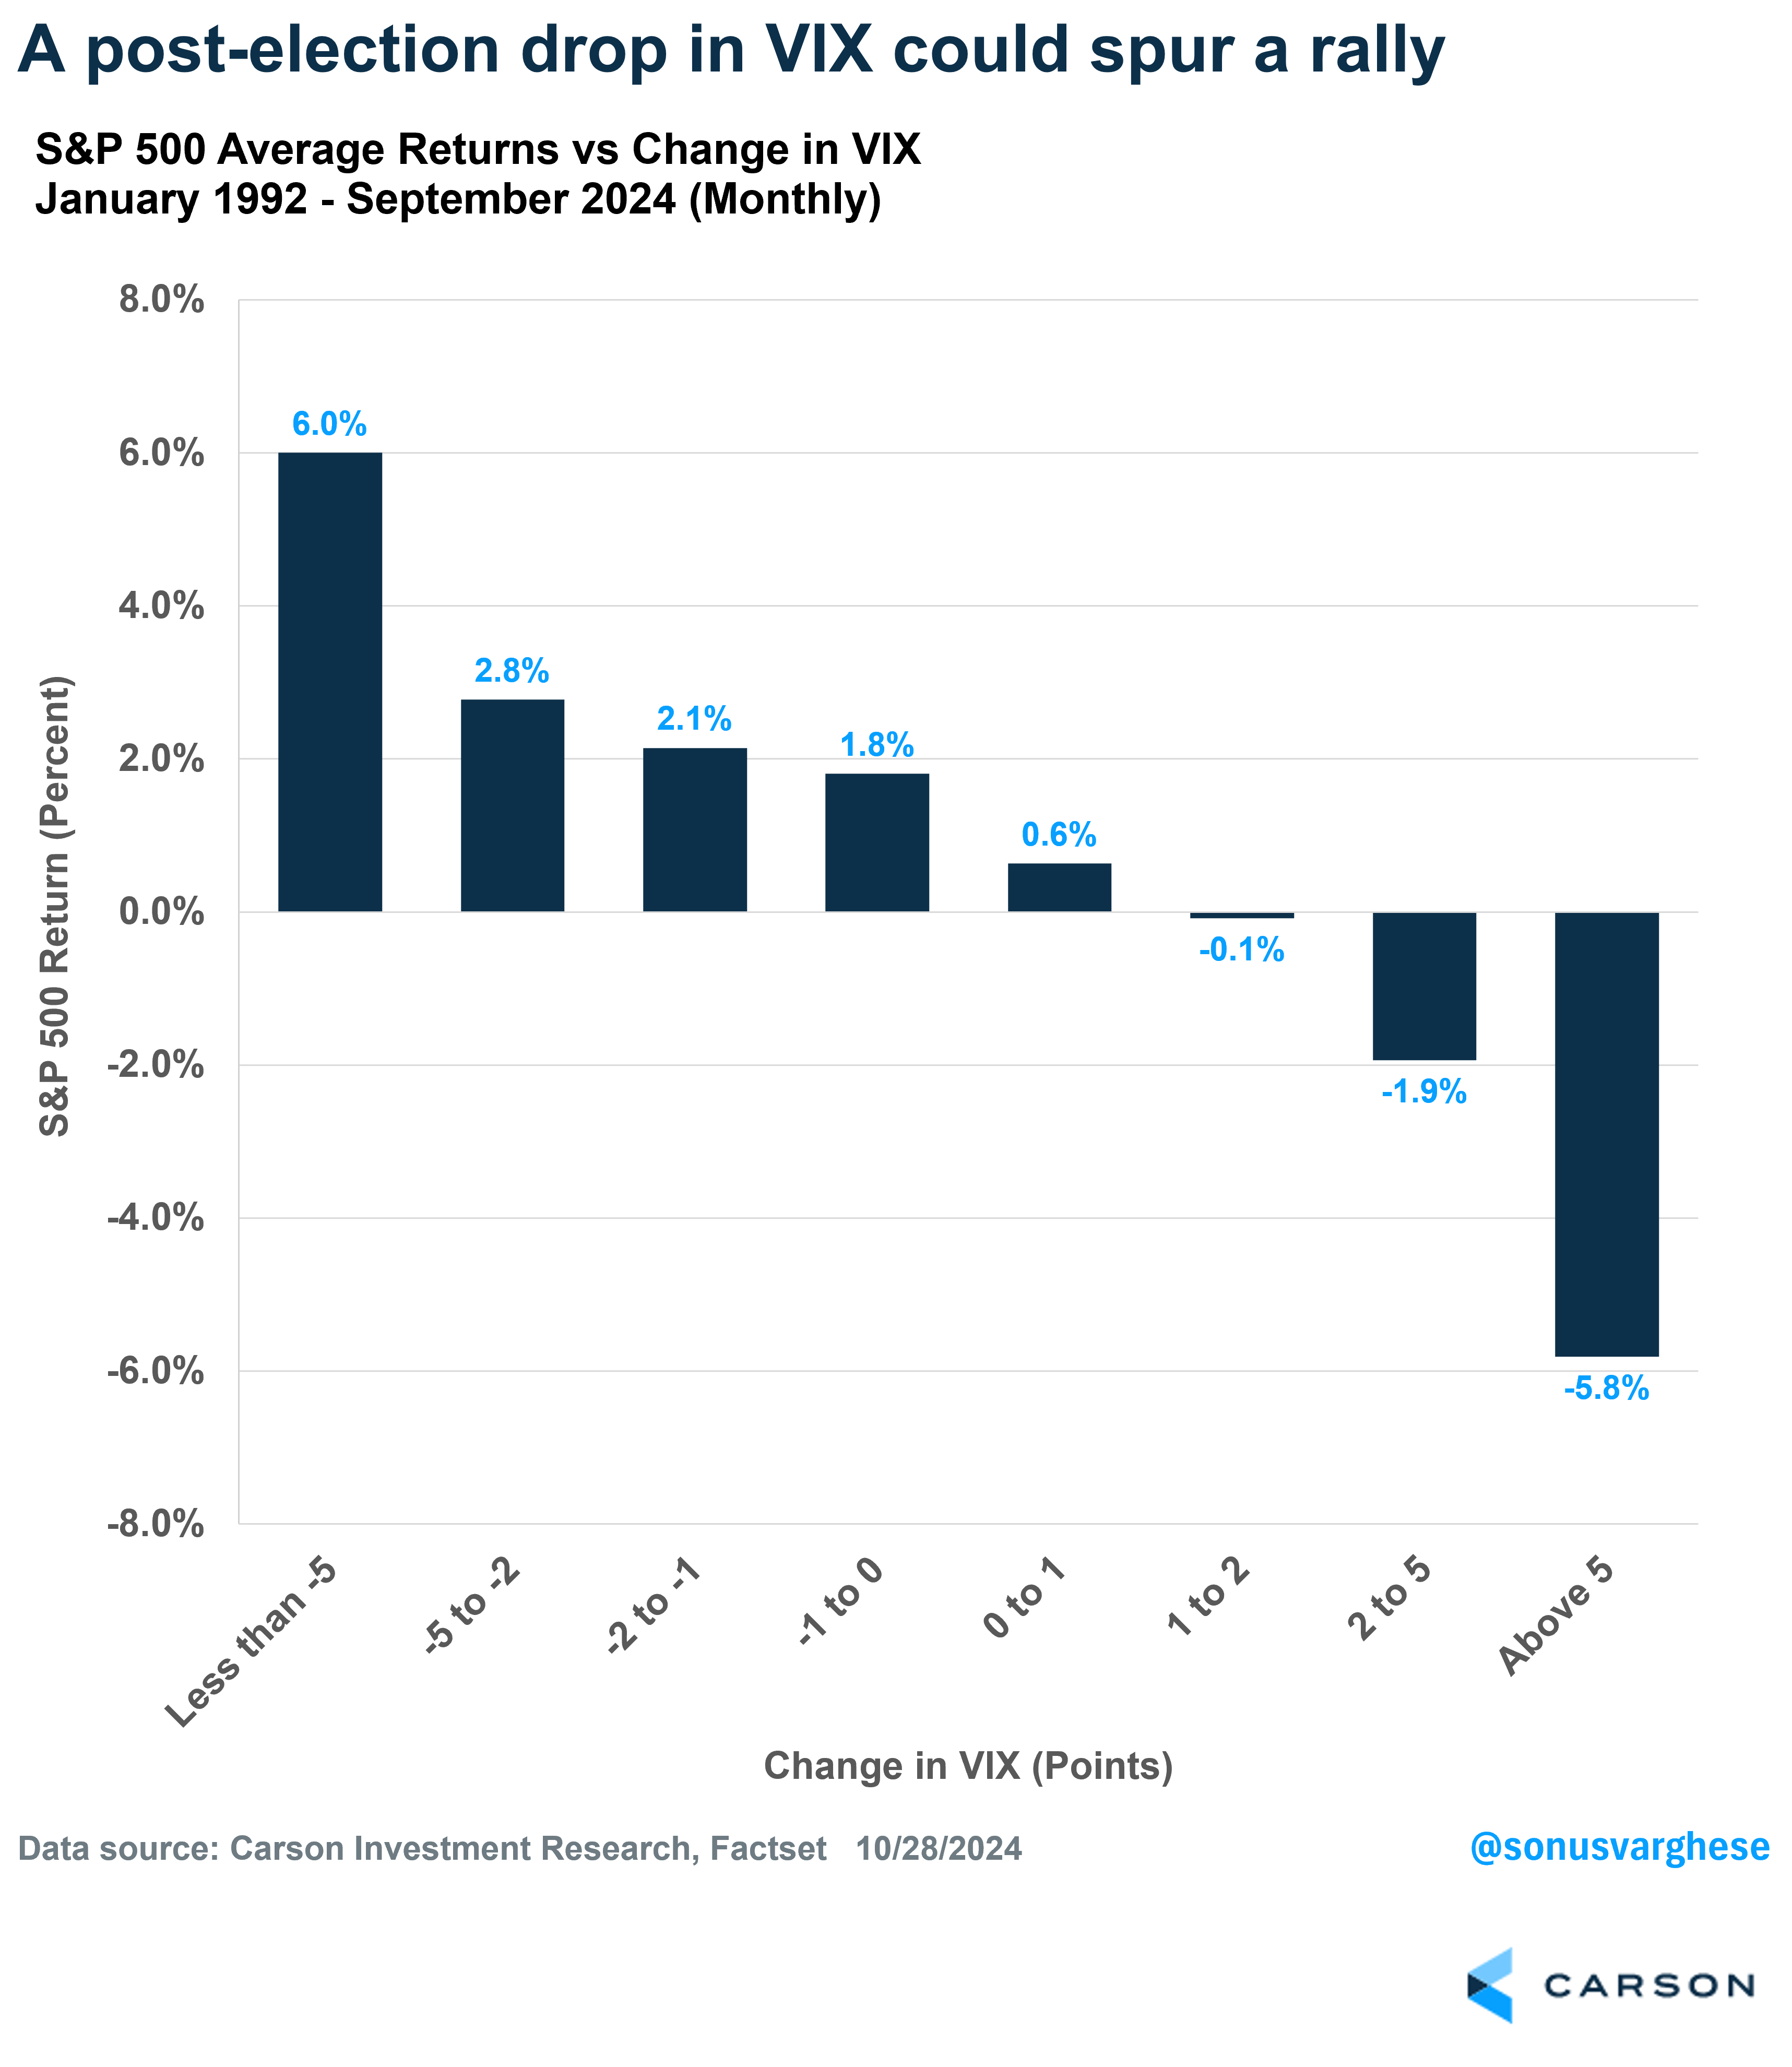
Here’s another way to look at it. Historically, when the VIX drops more than 5 points in a month, the average S&P 500 return is 6%. When the VIX drops between 2 and 5 points, the average return is 2.8%. These are fairly significant returns for just one month. The average return gets smaller when the VIX changes are smaller and turns negative when the VIX starts to increase (especially by large amounts).
This inverse relationship between the VIX and S&P 500 returns is not perfect. And for all we know, we could see volatility rise after the election, especially if there’s a lot of uncertainty about the results that lasts into December (if not longer). But odds are, markets are pricing in some uncertainty already, and that’s being reflected in the elevated VIX.
History Points to Post-Election Rallies
Ryan has crunched the numbers for post-election periods over the last 70+ years, and historically, we’ve seen markets rally over the November – January period (and even beyond). It doesn’t matter whether the election was close (like 1960 and 2020) or if it was a rout, when one candidate won big (like 1984 or 1996). The average 3-month return (November-January) is 4.0% and the average 6-month return (November-April) is 5.3%.
The only times the market really went the other way was when the economy was in a recession, as in 2008 and 2020. Excluding these two periods, the average 3-month return is 5.7% and the average 6-month return is 7.4%.

As I noted at the top, this year is off to a strong start. There’s a very common notion that these returns may be “pulled forward,” but that’s not how momentum works. Strength, and momentum, beget more of the same. Plus, there could be the tailwind of falling volatility as hedges come off post-election. We could also see a lot of investors who didn’t participate in the year-to-date rally begin to chase the rally before the books close for 2024. These are some of the reasons why the upcoming period has been strong for markets historically, and there’s not much reason to bet against that this year, especially with the economy as strong as it is and the Federal Reserve continuing to cut rates.
For more content by Sonu Varghese, VP, Global Macro Strategist click here.
02485096-1024-A